Curated OER
Place Value Through Hundred Thousands
In this place value worksheet, students study and examine the data in a table about 5 popular female names. Students solve 4 word problems utilizing the data from the table.
Curated OER
wordsnake- Word Puzzle- Data
In this wordsnake puzzle worksheet, students locate words that are associated with data. They start at an arrow on the page, and work their way across and down, but not diagonally, through a grid. They locate one word attached to another...
Curated OER
Mean, Mode, Median
For this mean, mode, and median worksheet, 8th graders solve and complete 6 different problems that include determining the mean, mode and median of various sets of numbers. First, they explain how to determine the median, mode and mean....
Curated OER
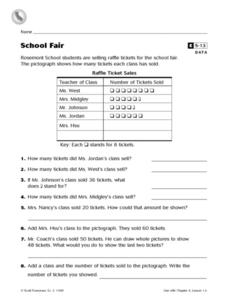
School Fair
In this data worksheet, students look over a table containing data collected from selling raffle tickets and then answer 8 short answer questions relating to the table.
Curated OER
Categorizing Data and Bias
In this categorizing data and bias activity, 9th graders solve 10 different problems that include various types of qualitative or quantitative data. First, they determine if the problem stated is univariate or bivariate data. Then,...
Curated OER
Statistics
In this statistics worksheet, 8th graders solve 4 problem sets related to an introduction to statistics. First, they find the range of each set of data. Then, students find the median and mode of each set of data. In addition, they...
Curated OER
Using Time Conversion Charts
In this time conversion worksheet, 8th graders solve 8 different problems that include using various types of time conversion charts for each situation. They determine when the data was taken and the age of the data using the listed...
Curated OER
Two Kingdoms of Bacteria
For this bacterial growth worksheet, students conduct an experiment on how temperature affects bacterial growth between a jar placed in the refrigerator and another in a warm place. They also describe what they would infer was the...
Curated OER
Independent Investigation
In this science worksheet, students write what they want to discover and identify what they feel will happen. Then they design an experiment and write the steps for it in the space provided. Students also create a data table or chart...
Curated OER
Motion on an Inclined Plane
In this physics worksheet, learners model the acceleration, velocity, and position of a cart moving up an inclined plane. They take data and determine a pattern in the data. Students also describe their findings and create an illustration.
Curated OER
Bikini Bottom Experiments
In this science worksheet, students read the description for each experiment and use their knowledge of the scientific method to respond to each of the questions. Then they write an experiment to test bubble power of the bubble gum...
Curated OER
Scientific Method
In this science instructional activity, students identify and locate each of the words to the right in the word search puzzle on the left. Then they list as many words as they can from the letters in scientific method.
Curated OER
Choosing the Best Graph
For this mathematics worksheet, 6th graders use a line graph to illustrate how a measure of data changes and explain their reasoning. Then they use a bar graph to compare pieces of data and a pictograph to compare data.
Curated OER
The Egg Hunt- Using a Graph to Answer Data Questions
In this pictograph worksheet, students answer questions based on a pictograph that shows colored Easter eggs. They follow the key that shows that each egg picture is equal to 10 eggs. They fill in the blanks with answers to how many, who...
Curated OER
Dollar Data
In this math worksheet, students examine a dollar bill in great detail. They record the facts in a data table and then give an oral report of the findings.
Curated OER
Chapter 7 Word Search
In this statistics worksheet, students locate and identify various vocabulary terms related to mathematics and statistics. There are seven words located in the puzzle to find.
Curated OER
Family Size
In this family size worksheet, students complete a tally chart to determine data from a family size line plot. They organize the data in the chart to determine the mean, median, mode, and range of the data. There are six problems in...
Curated OER
Computers Terminology
For this computers storage vocabulary worksheet, students fill in ten blanks with the vocabulary words from a word box dealing with computers.
Curated OER
Vacation Data Sheet
In this data learning exercise, students research a place that they would like to go on vacation. They name the country, whether it is sunny and hot, if there is a pool, and if it is a nice place to visit. Then they identify the...
Curated OER
Scientific Method
In this Scientific Method worksheet, learners demonstrate understanding of the Scientific Method by completing a chart. Students label the important steps taken while using this method in conducting an experiment.
Curated OER
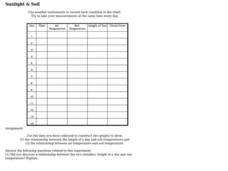
Sunlight & Soil
In this earth science learning exercise on sunlight and soil, students use data collected in a chart to construct two graphs. Following, they answer five questions as they relate to the experiment performed.
Curated OER
Mythology Spreadsheet
Students read a large variety of myths and discuss the characters and their attributes found in mythology. Then they identify and learn to set up an appropriate spreadsheet program. Students also enter the data to the class spreadsheet...
Curated OER
The Human Line Plot
Fifth graders collect data and use charts and line plots to graph data. Through class surveys, 5th graders collect data concerning a particular subject. They graph their data using a line graph. Students make inferences and predictions...
Curated OER
Getting A Grip On Graphs
Fourth graders investigate the concept of graphing and comparing different types of data using pictographs, line graphs, scatter plots, etc... They gather data and make interpretations while examining the medium of how it is displayed.


