Curated OER
Technical Literacy
Students explore the components of the transference of technological information through this ten lesson unit. The applications to specific careers, the determination of responsible use of technology, and the affects of technology on...
Curated OER
Being an Educated Consumer of Statistics
Students examine kinds of data used to report statistics, and create their own statistical report based on any of the four sources of media information (Internet, newspaper, TV, magazine).
Curated OER
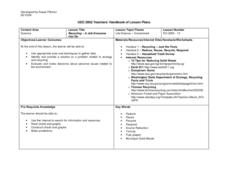
Recycling - A Job Everyone Can Do
Students research recycling effort that take place in the US. They play an online game and complete handouts using Internet research.
Curated OER
Fill in Your Future
Students discuss the Census 2000 slogan, "This is Your Future. Don't Leave It Blank." They design billboards for the slogan. They discover the role of the census in community planning and congressional representation.
Curated OER
Local Traffic Survey
Young scholars conduct a traffic survey and interpret their data and use graphs and charts to display their results.
Curated OER
Swish: Applying Statistics to Real Life
Sixth graders conduct on-line research of shot data and percentages for professional basketball players. They compare computed data to researched data and write a letter informing professional organizations of their findings.
Curated OER
Graphs and Spreadsheets
Students collect data and present it in a graph and/or a spreadsheet, depending on their previous understanding of technology.
Curated OER
Creating Graphs from Tables
Students interpret data from tables and then create a graph to show the same data in a different organization.
Curated OER
Dealing With Data
Young scholars collect, organize, and display data using a bar graph, line graph, pie graph, or picture graph. They write a summary describing the data represented and compare the graph to another graph in the class.
Curated OER
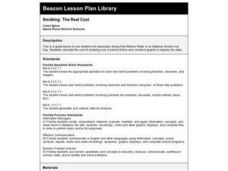
Smoking: The Real Cost
Third graders discuss the adverse effects of smoking and predict the financial cost of a smoking habit. They collect data regarding the cost of a pack of cigarettes and average packs smoked a day. They create bar graphs displaying the...
Curated OER
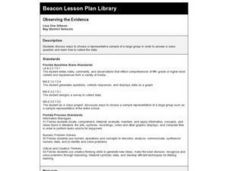
Observing the Evidence
Fifth graders explore how to do research from a large group. They explore how to choose a representative sample and collect data from it.
Curated OER
Dynamite Data
Second graders rotate through a variety of stations designed to offer practice in manipulating data. They sort, tally and count items and then create bar graphs, tables, and pie graphs to record their findings.
Curated OER
Graphing Climate Information
Seventh graders plot the data for the average monthly precipitation for three cities. They make a graph using a spreadsheet.
Curated OER
Candy Colors: Figuring the Mean, Median, and Mode
Students count candy by color and then calculate mean, median, and mode. They count candy and use the data to calculate mean, median, and mode (by color) and apply their learning to another collection of data.
Curated OER
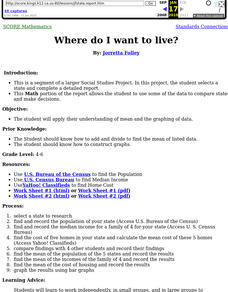
Where Do I Want To Live?
Students use a variety of Internet sources to gather income, population and housing data. Each group bring their results to the class and the class use their findings to compile mean population, income, and housing for all states.
Curated OER
Graphing Practice
Students study the ways to graph values. In this graphing lesson plan students read graphs and use a rubric to decide how well each is constructed
Curated OER
Qualitative and Quantitative Data
Seventh graders study the different ways that they have been evaluated over the years. In this qualitative and quantitative lesson students complete a learning activity while in groups.
Curated OER
Human Traits
Young scholars study vocabulary and complete a survey. In this human traits lesson students collect and analyze data then discuss what they learned.
Curated OER
Where to Live?
Students examine types of spatial data found in a GIS. In this geography instructional activity students use a GIS to facilitate analysis and decision making.
Curated OER
Friction and Inertia
Learners study friction and inertia, make predictions, and compare data. In this investigative lesson students view a demonstration on friction, divide into groups, and complete an activity.
Curated OER
Statistics and Probility
Seventh graders collect data and make predictions. In this geometry instructional activity, 7th graders work in tiers collecting data and plotting it. They make inferences and predictions about their collected data.
Curated OER
Sampling Distribution of Sample Means
Students collect data and crate a distribution sample. In this statistics instructional activity, students compare and contrast their collected data. This assignment requires the students to be comfortable with navigating the...
Curated OER
Data Analysis
Students examine techniques to represent data. In this data analysis instructional activity, students read about various ways to represent data, such as a stem and leaf diagram and calculating standard deviation. Students complete data...


