Curated OER
Air Pollution: Visible And Invisible
Fourth graders observe air pollution that is visible and invisible with experimentation. During the experiment the students collect data that needs analysis. The observations are recorded in the lab journal. The data also is represented...
Curated OER
Coin Drop
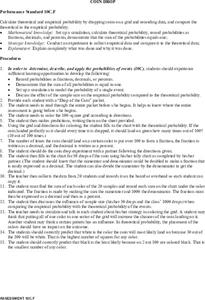
Students calculate the theoretical and empirical probability by dropping coins on a grid. They record their data and compare the theoretical and empirical data. Students make predictions about the results before conducting the experiment.
Curated OER
How is our place connected to other places?
Second graders conduct a survey, they record their data with the help of maps. They use an aerial photo or Ordnance Survey map, 2nd graders pinpoint specific places and add them to a legend using the drawing tools. Students use...
Curated OER
Matching Pairs
Learners examine the probability of the various findings in a game and determine the odds of winning. They differentiate between the facts of odds versus probability. Students use higher order thinking skills to explain how a problem is...
Curated OER
Math:Survey Role-Playing Activity
Students create survey questions to discover why students join clubs. Using sampling methods and question phrasing techniques, they conduct the survey both in and out of school. Once students analyze their survey information, they...
Curated OER
Weather Where We Are
Students investigate the reports of local weather. They identify types of weather data and correlate it to the conditions. Using the data students draw a picture of the current weather. They conduct the same investigation for all four...
Curated OER
Collecting My School Family Data
Students are tasked with collecting data on their school. In groups, they collect data on various aspects of school life along with social and economic backgrounds and charactertics of their hair and eye color. They draw two pictures,...
Curated OER
Fitting a Line to Data
Pupils work together in groups to collect data in relationship to how much water marbles can displace. After the experiment, they use the data to identify the linear equation to determine the best-fit line. They use the equation to...
Curated OER
Collecting and Organizing Data
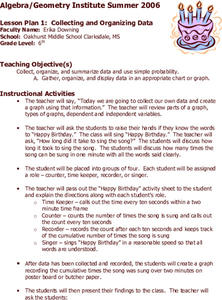
Sixth graders practice collecting and organizing data. In groups, 6th graders determine how many times "Happy Birthday" (at a reasonable rate) may be sung in ten seconds. They collect the information and create a graph.
Curated OER
Graphing Inertia: An Oxymoron?
Eighth graders investigate Newton's Law of Inertia in order to create a context for the review of the use of different types of graphs. They practice gathering the data from an experiment and put it into the correct corresponding graph.
Curated OER
What percent of ratio is proportion?
Ninth graders investigate the concepts of ratio and proportion.They solve examples with the teacher for ratios and proportions. A basic fraction review is used for a warm up in this lesson. The primary focus of the lesson appears to be...
Curated OER
What's The Teacher's Choice?
Fifth graders explore how to use data and display it using a chart or graph. They use food choices for categories and then gather the data and use the provided chart for display. In small groups students discuss the data and the results.
Curated OER
Exploring Probability
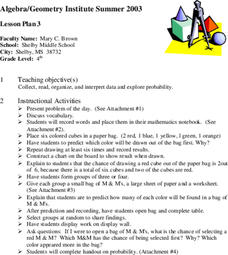
Fourth graders participate in a lesson that explores probability. They use candy and model cubes to experiment with different outcomes that can be charted if the students can proceed to the objective of the lesson. They discover how...
Curated OER
Graphing Pockets
Second graders explore graphing. They count the number of pockets on their clothes and use Microsoft Excel to enter their data. Students create a class graph displaying their findings.
Curated OER
Using SWMP Data
Students are introduced to the SWMP system which tracks short-and long-term changes in water. Using this data, they plot and interpret the data on a graph to determine how human activities are lowering the water quality. They also...
Curated OER
Monitoring Math with a Statistical Spreadsheet
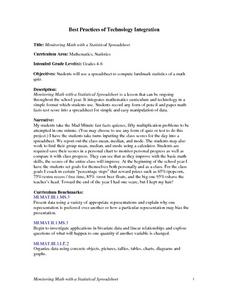
Students use a spreadsheet to compute landmark statistics of a math
quiz. This instructional activity can be ongoing throughout the school year and it integrates mathematics curriculum and technology in a simple format for student use.
Curated OER
FLY HIGH!!!
Students create their own bird study in their own schoolyard using the scientific method (see Testing a Hypothesis in Join the Project). Students do research in the library, at a local college, or on the Internet to determine the...
Curated OER
Paper Tower Challenge
Student explore the challenge of building a tower using paper. They build their tower using paper and record the height of their tower. Students collect and record the heights of other towers and use that data to create a spreadsheet.
Curated OER
Create a Survey and Analyze the Data
Eighth graders create their survey discussing wording used in surveys and try to create one that is unbiased. They distribute the survey to the middle school but not during instructional time. They then collect and analyze the data...
Curated OER
Bones and Math
students identify and explore the connection between math and the bones of the human body. Students collect data about bones from their classmates and from adults, apply formulas that relate this data to a person's height, and organize...
Curated OER
Weather temperatures
Students investigate the given statistics about temperatures in cities around the nation in order to look for a pattern. They measure the mean, median, and mode for the data set of temperatures.
Curated OER
Min-Max temperatures
Students investigate data of minimum and maximum weather temperatures over the period of one week. They answer guided questions in order to establish comprehension of interpreting the data.
Curated OER
Scientific Investigation- Magnets
Pupils conduct a scientific investigation to determine if a magnet attracts paper clips through different materials. Students write out their procedures, collect data and present it in a table or chart, and analyze their results.
Curated OER
Society, Cyberspace and the Future
Young scholars locate information on the rapid growth of world population and consumption needs through the use of Internet, Cd-ROMs, laser dics and other media. They use spreadsheet to present data gathered on world population growth...


