Curated OER
Analyzing Motion of a Tossed Ball
Students investigate the parameters involved with launching a basketball at an angle. In this motion lesson students predict and sketch graphs that show the motion of a ball toss.
Curated OER
Power Metering Project
Students collect and analyze variable data and understand the concept of electrical power. In this energy activity students use a spreadsheet to manage their data and create box plots.
Curated OER
Are There Too Many Elk?
Students study elk populations in Arizona. In this data lesson students read an article on monitoring elk populations, analyze data and make management recommendations.
Curated OER
Olympic Line Graphs
Sixth graders examine how to make line graphs. In this Olympic line graph lesson students make line graphs and search the given Internet sites to find data on their summer Olympic Game.
Curated OER
How Creepy!
Students observe and measure a model of slow down slope movement. In this graphing lesson students collect, record, and organize data that apply to models.
Curated OER
Forces and Masses and Motion, Oh My!
Students explore how varying force and mass effect the motion of an object. For this motion lesson students participate in a class activity and demonstrations.
Curated OER
Using Data Loggers
In this weather data worksheet, students use this worksheet to record data about temperature, wind speed, and more. Students complete 18 spaces on the chart.
Curated OER
The Working of Scientists
Students define and explain the basic concepts of experimental design. In this scientific method lesson students complete a hands on activity, develop and present proposals to test their explanations.
Curated OER
Looking into Surface Albedo
Students demonstrate how the color of materials on Earth affect the amount of solar energy that is absorbed. In this solar energy lesson plan students complete a lab to explore how the color of materials on the Earth's surface...
Curated OER
Oil and Energy Consumption
Students analyze the oil consumption and production information. In this investigative lesson students take the data collected, graph and organize it then draw conclusions about the use of oil worldwide.
Curated OER
Do You Need a Map?
Students explain ways marine navigation is important in modern society. In this map study lesson students use a retrieval tool to obtain real-time information on weather forecasts.
Curated OER
Yeast Cells and their Environment
Students study the scientific method and explore how to design an experiment. In this investigative lesson students explore and hypothesis an experiment then carry it out to find the results.
Curated OER
Among the Hidden - Population Math Activity
In this population instructional activity, students collect data on population by researching the Census Bureau and then make online graphs and answer short answer questions about the data. Students complete 5 problems total.
Curated OER
Ready, Set, Drift!
Students define data, recover data from the Internet, and use information they obtain to solve problems. In this investigative lesson students answer questions on a worksheet and demonstrate the use of a maneuvering board in...
Curated OER
Bats and Hot Dogs
Students identify patterns and relationships from data that is collected and solve variables. In this investigative lesson students study ocean productivity, the nitrogen cycle and phytoplankton then answer questions.
Curated OER
Marine Debris and Me
Students study the environmental issues that pertain to the marine environment. In this research ocean landfills lesson students come up with alternative means of disposal.
Curated OER
One Plus One Makes New
Students discover the properties of matter and how they change when composite materials are produced. For this informative lesson students write up a question and procedure to an experiment then analyze and draw conclusions based...
Curated OER
Hurricanes and Climate
Pupils investigate maps and data to learn about the connections between hurricanes and climate. In this exploratory activity students describe and graph the 6 regions where hurricanes happen and discuss how hurricanes have changed over...
Curated OER
Describing Data
In this data worksheet, students complete multiple choice questions about mean, median, mode, and range. Students complete 10 questions total.
Curated OER
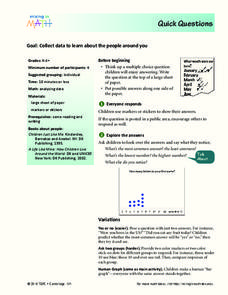
Quick Questions
Students ask their classmates survey questions. For this survey lesson, students come up with a question and possible answers. Their classmates mark their answers and the class discusses what they notice.
Curated OER
Getting to Know You
Students create survey questions for their classmates. In this survey instructional activity, students pick a yes or no question and find what fraction of the class responded yes. They discover how the wording of a survey question can...
Curated OER
Give Me a Minute
Students categorize data. In this categories lesson, students get a specific topic and they have a minute to list as many items that fit under this topic. They compare lists with a classmate and discuss whether all answers work.
Curated OER
Pictures of Data: Post Test
For this data worksheet, students answer multiple choice questions about charts and graphs. Students answer 10 questions total.
Curated OER
Using Data to Make Graphs: Pretest
For this data worksheet, 5th graders answer multiple choice questions on data and graphs. Students answer 10 multiple choice questions.


