Curated OER
Graphing Fun
First graders analyze objects and make a graphing picture to analyze the data. In this graphing lesson, 1st graders complete an object graph assessment, a picture graph assessment, and a bar graph assessment to analyze their given objects.
Curated OER
Let's Line Them Up!
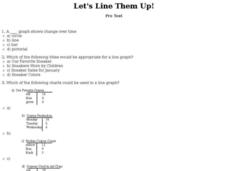
In this line graph activity, students read through the problems about graphing and line graphs. Students select the best answer to solve the 10 online questions.
Curated OER
2006 Census Teacher's Kit: Consequences Report Card
In this analyzing the Census learning exercise, students assess the consequences of change using data from the 2006 Census. Students analyze the economic, social, and political wellbeing of each stakeholder.
Curated OER
Sweethearts and Data Analysis
Learners explore the concept collecting and representing data. In this collecting and representing data lesson, students record the different colors of sweetheart candies in their sweethearts box. Learners create a table of the data and...
Curated OER
Mean, Median, and Mode
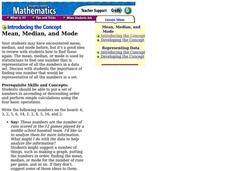
Students calculate the mean, median, and mode in a set of numbers. In this data analysis lesson, students put a set of numbers in ascending order and perform calculations to find the mean, median, and mode.
Curated OER
Descriptive Statistics
Students demonstrate how to use frequency and scatter diagrams. In this statistics lesson, students are introduced to different techniques of representing data. Students sort and graph data on a worksheet and use a frequency diagram to...
Curated OER
Data Analysis
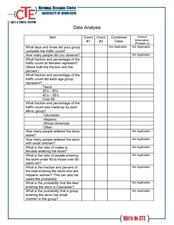
Students examine techniques to represent data. In this data analysis lesson plan, students read about various ways to represent data, such as a stem and leaf diagram and calculating standard deviation. Students complete data analysis...
Curated OER
Using Current Data for Graphing Skills
Students graph demographic information. In this graphing instructional activity, students choose what type of graph to create and what information to display. Links to examples of graphs and statistical data are provided. The graphs are...
Curated OER
Data Analysis
In this data analysis worksheet, students complete several activities to analyze data. Students calculate the mean, median, mode, and range for the 14 problems.
Curated OER
How Old Are You? -- Class Bar Graph
In this math worksheet, students participate in a group bar graph activity. Students survey their classmates about their ages and plot the results on this graph. Choices given are 5,6,7 or 8.
Curated OER
How Many Legs Does Your Pet Have?-- Class Bar Graph
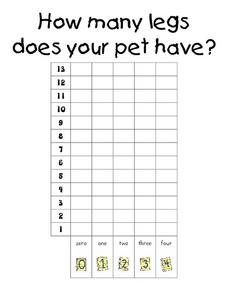
For this math worksheet, students collaborate as a class to make a bar graph displaying how many legs the students' pets have. Results are plotted on the graph.
Curated OER
If It Were Raining, Would You Rather Play Indoors Or Outside?-- Class Bar Graph
In this math instructional activity, students collaborate as a class to complete a bar graph. Students survey classmates as to their preferences in where they like to play. Data is plotted on the bar graph.
Curated OER
Which of These Animals Have You Ridden Before?-- Class Bar Graph
In this math worksheet, students collaborate to make a bar graph. Students survey classmates as to which animal they have ridden before: elephant, horse, llama, ostrich or camel. Results are plotted on a graph.
Curated OER
How Many Televisions Do You Have in Your Home?-- Bar Graph
In this math learning exercise, students participate in a group graphing activity. Students survey classmates as to how many televisions are in each home and plot the results on a bar graph.
Curated OER
How Many Vowels Are in Your Name?-- Class Bar Graph
In this language arts/math activity, students collaborate to make a group graph. Students survey classmates about how many vowels are in names. Results are plotted on a bar graph.
Curated OER
Which Vegetable Do You Like To Eat the Most?-- Class Bar Graph
In this math activity, students participate in a group graphing activity. Students are surveyed on favorite vegetables and the results are plotted on a bar graph.
Curated OER
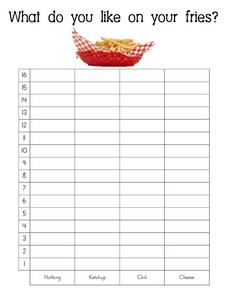
What Do You Like on Your Fries?-- Class Bar Graph
In this math worksheet, students participate in a group graphing activity. Students are surveyed about what they like on their fries: nothing, ketchup, chili or cheese. Results are plotted on a bar graph.
Curated OER
Would You Rather Have a Pet With Fur, Fins, Or Feathers? --Class Bar Graph
In this math activity, learners participate in a group graphing activity. Students are surveyed about favorite types of pets: with fur, feathers or fins. Results are plotted on this class graph.
Curated OER
Math: Methods of Measurement
Fourth graders practice linear measurement skills by applying various measuring instruments to determine the heights of classmates. By measuring the heights of second graders and fourth graders, they construct tables of height and age...
Curated OER
R-Project
Students analyze the outcome of a scientific experiment using free downloadable software. They collect experimental data to use statistical software to determine if the observations are likely due to the treatment or random chance.
Curated OER
Data Analysis, Probability, and Discrete Math: Lesson 6
Eighth graders engage in a lesson that is concerned with the concepts surrounding the interpretation of information included in graphs for analysis of data for probability. They examine circle graphs and differentiate the values of...
Curated OER
Data Analysis, Probability, and Discrete Math: Lesson 5
Eighth graders are read the material that is printed in boldface type inside the boxes. Information in regular type inside the boxes and all information outside the boxes should not be read to them. They then find the mean, median,...
Curated OER
Unexpected Answers
Students explore and complete a variety of activities demonstration probability. They make observations about the results of the activities. Students complete and discuss conditional probability. Also, students draw conclusions about...
Curated OER
Data Analysis, Probability, and Statistics: Exploring Websites
Students measure their pulse rates and place the number on the board. They arrange the numbers in order and discuss the differences between isolated facts and data. Students explore websites that relate to data analysis and report their...


