Curated OER
Watch the Sky: Observing Clouds and Patterns
Students observe clouds outside of the classroom. In this weather activity, students investigate and record the clouds above their classroom everyday for three weeks. The students then analyze their data and discuss what causes specific...
Curated OER
200 Years and Counting: How the U.S. Census Tracks Social Trends
Students examine the process of census taking in the United States. In this "200 Years and Counting" activity, students examine the data collection process, look at an example of a census form, analyze data, and learn what the...
Curated OER
Solar Activity
In this solar activity worksheet, students complete a puzzle given a word bank with matching numbers. The numbers correlate to the answers to basic math problems that use the order of operations. Students use their mathematical answers...
Curated OER
Data! Data! Graph that Data!
Fifth graders create data graphs using Microsoft Excel. In this data collection instructional activity, 5th graders create and conduct a survey, then use Excel to organize and graph their data.
Curated OER
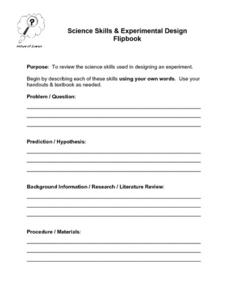
Science Skills and Experimental Design
In this experimental design worksheet, students describe the different science skills required when designing an experiment. Then students create a flipbook with the information. This worksheet has 9 short answer questions.
Curated OER
Creating Circles
Learners make a circle graph. In this graphing lesson, the teacher conducts a class survey, then demonstrates how to make a pie graph. When students are comfortable with the material, they use a worksheet to create their own graph.
Curated OER
Our Favourite Halloween Treat
Students conduct a survey about Halloween candy and create a bar graph illustrating the data. For this data analysis lesson, stud nets are introduced to the topic with a discussion and survey, then the class creates a large graph and...
Curated OER
The Perfect Principal
Students demonstrate their understanding of math skills. In this data analysis lesson, students complete a worksheet requiring them to calculate mean, median, and mode, and create and interpret graphs. Lesson is intended as an assessment...
Curated OER
How Many People Live in Your Household?
Students create a pictograph showing household size for the class.In this data collection and graphing lesson, the teacher guides students through the creation of a concrete object graph, then students analyze and summarize the results.
Curated OER
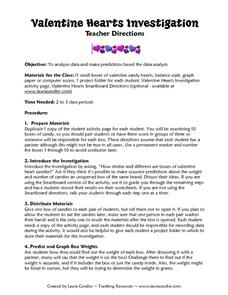
Valentine Hearts Investigation
Students practice analyzing data and making predictions. For this 2nd - 3rd grade lesson plan, students investigate and compare data gathered using boxes of valentine candy hearts. Students examine the different boxes of candy...
Curated OER
TV Survey - Data Collection and Analysis
In this data collection and analysis worksheet, 4th graders complete a tally chart about the number of hours that fourth graders watch television. They create a bar graph with the information, write a paragraph about the survey results,...
Curated OER
Exploring Online Data Analysis Tools Project Interactivate- Plop It
In this data analysis activity, students access an online data analysis tool at the given web site. They collect name length data for classmates and enter it into the tool. The find and manipulate the data to determine how the median is...
Curated OER
Favorite Days of the Week
In this bar graph worksheet, students use the blank graph to survey classmates and record their favorite day of the week. Students think of one question about the graph and write it on the line.
Curated OER
Immigration: Stories of Yesterday and Today
Students use Web technology to access immigration history and develop an understanding of the concept of immigration. Then they develop oral history writing skills, including note-taking and conducting an interview and read for detail....
Curated OER
Move My Way: A CBR Analysis of Rates of Change
Learners match a given velocity graph and sketch the corresponding position graph using a graphing calculator. After collecting data from their everyday life, learners use specific functions on their calculators to create graphs and...
Curated OER
Time Management
Students plot activities for a 24 hour day. They record their information on a spread sheet program. Students list categories they use and write equations for cells that add cells of each category together. Students create a pie chart of...
Curated OER
Data Analysis, Probability, and Discrete Mathematics
Fourth graders analyze the data in a bar graph, pictograph, line graph, and a chart/table and draw conclusions based on the data. They discuss each type of graph, write questions for each graph, and analyze the data as a class.
Curated OER
Download and Analyze
Students download information from a NASA website into a database. They transfer it to a spreadsheet by completing the information and analyze the information. They determine temperature averages, mode, and graph the results. They write...
Curated OER
Using Primary Source Documents in the Classroom
Students use primary documents to explore the past. They consider the source of the documents and identify and biases that the author may have held. They identify any questions about the historical event that may remain after reading the...
Curated OER
Cyber Chow Combos
Students, after watching the CYBERCHASE episode, "A Day at the Spa,"represent and count combinations of choices using tree diagrams.
Curated OER
Baseball Statistics
Students read "Casey at the Bat" and then use individual player statistics (found through internet research)to determine if their players could be considered baseball "heroes". They must justify their choices for "hero" by creating...
Curated OER
How Do Earthquakes Affect Buildings?
Students simulate earthquakes utilizing an online program, and examine the earthquake-proofing construction for their building. They chart and analyze their simulated data using
Curated OER
Teaching about Data Interpretation
Students explore a variety of relevant lake water chemistry questions, compose responses, and present their results in a poster format. They, in pairs, answer questions about lake chemistry which are imbedded in this plan.
Curated OER
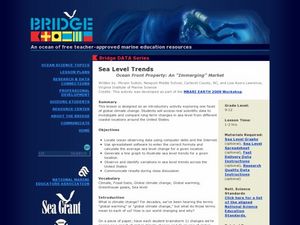
Sea Level Trends ~ Ocean Front Property: An "Immerging" Market
Young oceanographers take a look at sea level data from several cities over a few centuries. They use the data to fuel a discussion about what kind of changes are taking place and the impact they are having on the coastal ecosystems....


