Curated OER
Growing Plants
Students grow plants and track their growth over time. For this growing plants lesson, students plant seedlings and chart their growth in a data analysis activity.
Curated OER
Tables, Charts and Graphs
Students examine a science journal to develop an understanding of graphs in science. In this data analysis lesson, students read an article from the Natural Inquirer and discuss the meaning of the included graph. Students create a...
Curated OER
Shopping With a Circle Graph
In this shopping with a circle graph worksheet, students use the data in the graph to answer 8 questions about the money they have and how they can spend it.
Curated OER
Using Extrapolations
In this using extrapolations worksheet, 6th graders use data analysis to answer nine questions about data prediction and extrapolation.
Curated OER
Mean, Mode and Bar Graphs
In this mean, mode and bar graphs worksheet, 5th graders analyze the data given, then answer three questions about a bar graph and the data shown.
Curated OER
Population Dilemma
Ninth graders explore population growth. In this Algebra I activity, 9th graders conduct an experiment simulating population growth. Students create a model and relate the results to a real-world situation. Students create a scatter...
Curated OER
Mathematical Reasoning
In this data analysis worksheet, students read a list of 4 criteria and then select the picture on the sheet that matches the criteria.
Curated OER
Data Handling Techniques
Students study data analysis methods. For this data analysis lesson, students study data compression and data editing methods used for the spacecraft Galileo. Students study the 'lossless' and 'lossy' techniques.
Curated OER
What's Your Favorite Season?
Pupils collect data on the favorite seasons. In this data collection and analysis lesson, students learn about displaying data on charts and graphs. They collect data about the favorite seasons of the children in their class and display...
Curated OER
Data Analysis
In these data analysis worksheets, students complete 4 worksheets of activities for analyzing data. Students use the mean, median, mode, and range to organize the data.
Curated OER
Algebra: Sorting, Representing, and Patterns
Students sort objects and create patterns. In this sorting and graphing lesson plan, students work at centers to find a way to sort a group of objects, then make a graphical representation of the number of each item. Finally, students...
Curated OER
Learning to Make Bar Graphs
Students construct bar graphs using the results from various experiments. In this graphing lesson, students review data from a previous experiment and demonstrate how to construct a bar graph. Students use a checklist to ensure...
Curated OER
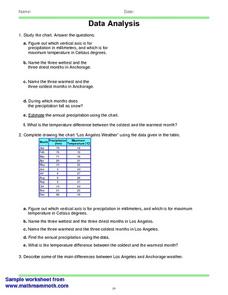
Canada's Climate: Temperature and Rainfall Variations
Students analyze data about various climates in Canada. In this data analysis and climate lesson, students use Canada Year Book 1999 to complete a worksheet and make connections between precipitation and temperature in different climates.
Curated OER
Graphing in the Information Age
Students create a variety of graphs based on population data. In this statistics instructional activity, students use data that can be gathered on-line to make a bar chart, line graph, and circle graph.
Curated OER
Collect and Organize Data
In this data analysis learning exercise, 4th graders use a tally chart about favorite television programs. They record which are least or most popular, rankings, and combinations of programs.
Curated OER
Data Analysis Self-Test
In this data analysis worksheet, students complete 1 problem that has 7 parts involving mean, median, mode, range, and quartiles. Students then perform 5 operations with matrices.
Curated OER
Data Analysis
In this data analysis learning exercise, 9th graders solve and complete 8 different problems. First, they add each of the matrices shown at the top. Then, students subtract the matrices. They also multiply and simplify the given expression.
Curated OER
Data Analysis
In this data analysis worksheet, 8th graders solve and complete 4 different problems that include determining the line of best fit for each. First, they write the prediction for an equation for each situation described. Then, students...
Curated OER
Data Analysis 2
In this data analysis worksheet, students read and interpret given line graphs. They determine the range and average. This one-page worksheet contains five problems.
Curated OER
What Do You Like To Do the Most After School?-- Class Bar Graph
For this math worksheet, students collaborate to make a class bar graph which will display data on favorite leisure time activities. Students survey their classmates and plot the results on the graph. Six choices are given: games, read,...
Curated OER
What Do You Like on Your Popcorn?-- Class Bar Graph
In this math worksheet, students participate in a class bar graph activity. Students survey classmates as to their popcorn preferences: nothing, butter or salt. Results are plotted on the graph.
Curated OER
How Do You Like Your Sandwich? --class Bar Graph
In this math worksheet, students participate in a group bar graph activity. Students survey their classmates on favorite sandwich choices: peanut butter and jelly, grilled cheese or meat. Results are plotted on a bar graph.
Curated OER
How Many Brothers And Sisters Do You Have? -- Class Bar Graph
In this math worksheet, students collaborate in generating a class bar graph which displays information about how many brothers and sisters each classmate has. Data is plotted on a bar graph.
Curated OER
Which Kind of Weather Do You Like Best? -- Class Bar Graph
In this math worksheet, students generate a class bar graph. Classmates are surveyed about favorite weather: sunny, rainy, snowy, cloudy or windy. Results are displayed on a bar graph.


