Curated OER
Wacky Water World: Student Worksheet
This well-designed math worksheet invites learners to work in pairs in order to determine which plan is the better value when going to an amusement park. Plan A and Plan B each have different admission fees, and different rates per ride....
DK Publishing
Using Information in Tables
Find out how well can your second or third graders use tables to solve word problems by assigning this single-page worksheet. Two tables with different sets of data prompt learners to solve six problems. An example at the top of the page...
Curated OER
Reading Tally Chart
As learners explore data analysis have them practice reading tally charts using these examples. They answer basic questions about each of three charts, employing addition and subtraction skills. For example, a chart tallying t-shirts...
Curated OER
Chocolate Preferences Voting and Graphing Techniques
Students practice sampling and graphing techniques. In this data collection and interpretation instructional activity, students write and conduct surveys about chocolate preferences and then collect their data. Students graph the data in...
Curated OER
Cruel Schools
Students survey the climate of their school. In this personal health lesson, students discuss bullying and violence in schools. Students then complete a school climate survey, compile the results, and interpret them. Students write data...
Curated OER
Water Resources
Students study water resources that are important to the people of North American and Africa. They use satellite images and data to explore how human actions can degrade, improve, or maintain water resources. They analyze and interpret...
Curated OER
Role-Playing Jean Talon
Learners explore New France. In this New France lesson, students examine census data compiled by Jean Talon in 1665 and 1666. Learners take on the role of Talon trying to convince the King of France to increase his investment in New...
Curated OER
Chinese Immigrants in British Columbia, 1870
Students interpret historical evidence presented in primary and secondary resources. In this British Columbia history lesson, students read and analyze data regarding 1870 Canadian census data. Students...
Curated OER
Gathering Data About Respiration
Students engage in an experiment that tests how much air we breathe in and out during the respiration process. For this respiration lesson, students blow a typical breath's amount of air into a balloon. They use a ruler to measure the...
Curated OER
Paws in Jobland: Lesson Plan 35 - Catch of the Day
Students study information for fish farm workers given in the form of a chart, in order to practice interpreting data while learning about the career of a fisherman. In this data interpretation lesson, students read the chart to find out...
Curated OER
Go Fish!
Eighth graders use goldfish crackers to simulate a capture-recapture method of data collection. They fill in a chart and determine the averages. They find the estimated population of fish and the actual population of fish based on the...
Cyberbee
Cyberbee: Who Dunnit?
If you are a crime scene investigation (CSI) fan, then you will love this site! You get to be the detective by examining the evidence, viewing the crime scene, dusting for fingerprints, interviewing the suspects, and solving the crime.
Wolfram Research
Wolfram Math World: World's Most Extensive Mathematics Resource
MathWorld provides a huge mathematics encyclopedia detailing the concepts of geometry, algebra, calculus, discrete math, number theory, and other math topics--complete with formulas, diagrams, examples, and references for thorough...
Other
Stat Soft: Getting Started With Statistics Concepts
Definitions of the basic concepts in statistics. Great for review and discussion or for introduction into topics.
McGraw Hill
Glencoe: Self Check Quizzes 2 Making Predictions
Use Glencoe's Math Course 2 randomly generated self-checking quiz to test your knowledge of using data to make predictions. Each question has a "Hint" link to help. Choose the correct answer for each problem. At the bottom of the page...
Annenberg Foundation
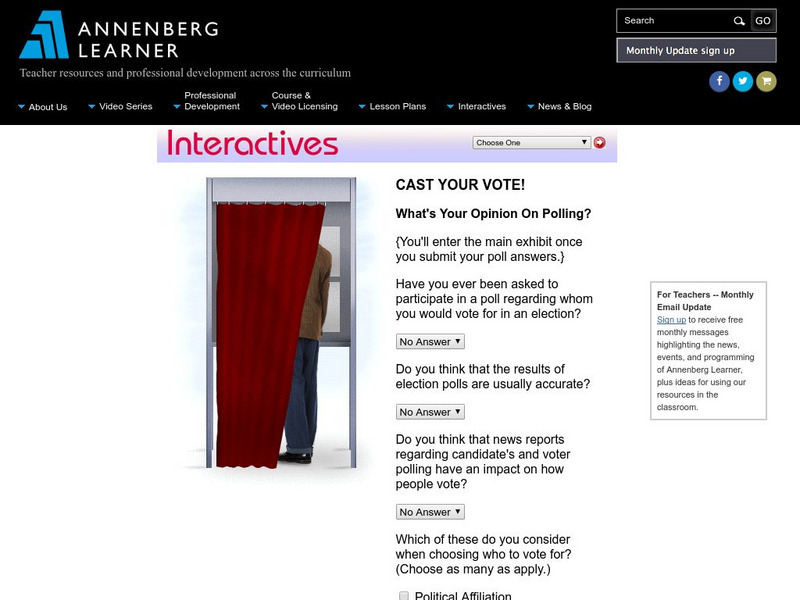
Annenberg Learner: Interactives: Cast Your Vote!
Upper elementary, middle, and high school students can use this exhibit to get an understanding of how polls and elections are conducted. The discussion includes random samples, margins of error, and other concepts related to statistics.
Center for Innovation in Engineering and Science Education, Stevens Institute of Technology
Ciese Real Time Data Projects: Weather Scope: A Study of Weather and Climate
Use real-time data to study factors that affect weather and climate, create weather instruments, and share data with students around the world.
Center for Innovation in Engineering and Science Education, Stevens Institute of Technology
Ciese: Collaborative Projects
Using a variety of science topics, these projects link your class with classes around the world in data collection and analysis. There are projects recommended for all grade levels. Begin dates and end dates are listed to help in...
Howard Hughes Medical Institute
Hhmi: Bio Interactive: Effects of Natural Selection on Finch Beak Size
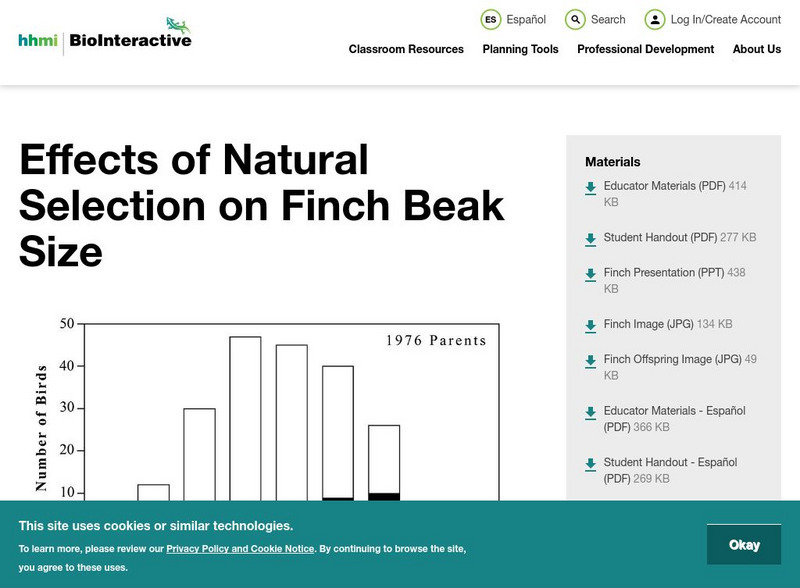
In this activity, students examine research on finches on the island of Daphne Major in the Galapagos Islands. The depth of the finches' beaks was measured before and after a drought. This data is displayed in graphs and students are...
BSCS Science Learning
Bscs: Restoring Oyster Reefs
After learning about the role of oysters in an estuary ecosystem and a population decline that oysters have faced over time from overharvesting and pollution, students work with data to determine where are ideal sites for restoring...
BSCS Science Learning
Bscs: Restoring Oyster Reefs
After learning about the role of oysters in an estuary ecosystem and a population decline that oysters have faced over time from overharvesting and pollution, young scholars work with data to determine where are ideal sites for restoring...
University of Illinois
University of Illinois: Data Types
The University of Illinois provides this site that is helpful because of the various kinds of data that can be collected. This lesson plan helps students differentiate between qualitative, quantitative, and many other types of data.
National Council of Teachers of Mathematics
The Math Forum: Seventh Grade Mathematics: Data Sense
This site has some interesting ways to collect and evaluate data. There are some activities about note taking, spreadsheets, surveys, and a cool bridge construction project. Teachers may want to use this site as a resource for some...
University Corporation for Atmospheric Research
Ucar: Project Sky Math
Teachers will be interested to explore the SkyMath module, and the 16 classroom activities at this site. In this program, students will collect and record real-time weather data to analyze. Data analysis, graphing, number relationship,...


