Curated OER
Statistics of Mars
Students explore the concept of central tendencies. In this central tendencies lesson plan, students sort M&M's or Skittles based on color. Students graph their results. Students find the mean, median, and mode of their data.
Shodor Education Foundation
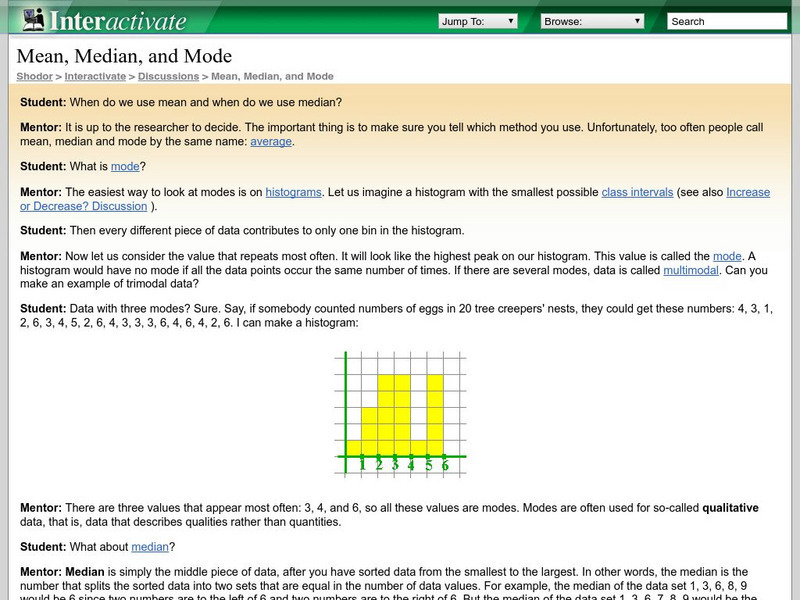
Shodor Interactivate: Mean, Median, and Mode Discussion
This is a virtual discussion between a mentor and student involving mean, median, and mode. Discusses when each is used and how they are found.
Shodor Education Foundation
Shodor Interactivate: Lesson: Introduction to Statistics
"The goal of this lesson is to introduce the concepts of mean, median and mode and to develop understanding and familiarity with these ideas." This lesson is provided by Shodor Education Foundation.
McGraw Hill
Glencoe: Self Check Quizzes 2 Mean, Median and Mode
Use Glencoe's Math Course 2 randomly generated self-checking quiz to test your knowledge of finding the mean, median and mode. Each question has a "Hint" link to help. Choose the correct answer for each problem. At the bottom of the page...
McGraw Hill
Glencoe: Self Check Quizzes 1 Mean
Use Glencoe's randomly generated self-checking quiz to test your knowledge of finding the mean for a data set. Each question has a "Hint" link to help. Choose the correct answer for each problem. At the bottom of the page click the...
Missouri State University
Missouri State University: Introductory Statistics: The Normal Curve
Provides lengthy explanations of the measures of central tendencies - mean, mode, and median - and the measures of variability - range, variance, standard deviation - are given here. Graphs of interesting "side items" are presented as...
E-learning for Kids
E Learning for Kids: Math: Music Center: Mixed Problem Solving
Help Dracco the drummer with solving different fun math problems.
Concord Consortium
Seeing Math: Plop It
Plop It! lets you experiment with the concepts of mean, median, and mode (measures of center). You see the differences among them on a bar graph, as you add or remove blocks to an axis with a given range.
Houghton Mifflin Harcourt
Holt, Rinehart and Winston: Homework Help Independent Practice: Measures of Central Tendency
Get independent practice working with the mean, median and mode. Each incorrect response gets a text box explanation and another try. Correct responses are confirmed.
AAA Math
Aaa Math: Central Tendencies Notes
A complete description of mean, median and mode. Interactive games and practice exercises are included.
Texas Instruments
Texas Instruments: Math Today for Ti Navigator System Super Ticket Sales
Students will create two box-and-whisker plots of the data in the USA TODAY Snapshot, "Super ticket sales". Students will calculate central tendencies for both sets of data. Students will compare the two sets of data by analyzing the...
Texas Instruments
Texas Instruments: Parts Is Parts
Students find a sample of a given size with a given mean. In this activity, students show one way 100 families can have a mean of 2.58 children and understand the meaning of the term "average".
Texas Instruments
Texas Instruments: Measures of Central Tendency
Mean, median, and mode are measures of central tendency in data analysis. Each can be used to identify central tendency. Box-and-whiskers plots are a visual representation of collected data involving medians.
Texas Instruments
Texas Instruments: Math Today Super Ticket Sales
Students will create two box and whisker plots of the data in the USA TODAY Snapshot. They will calculate central tendencies for both sets of data and compare the two sets of data by analyzing the differences in the box and whisker plots.
BBC
Bbc Revise Wise Maths: Mode, Median, Mean
This website from the BBC is a great introduction to averages (mean, median, and mode) and will take you through some interactive learning activities. A practice test and worksheet are also provided.
Texas A&M University
Wtamu Virtual Math Lab: Beginning Agebra: Central Tendencies
A tutorial to understand the three central tendencies and how to find them, as well as the standard deviation of values. Offers a discussion and practice problems.
Palomar Community College District
Palomar College: Mode, Median, Mean Examples
A series of step-by-step worked problems demonstrating how to take a set of data and produce the measures of central tendency. Hints are provided along the way and the final measures are shown for the user to check.
National Council of Teachers of Mathematics
Nctm: Comparing Properties of the Mean and Median
Through the use of technology, students can investigate how the mean and median of a set of date compares when values the data changes.
Other
College of Natural Sciences: Measures of Location
Different measures of location are discussed in terms of box and whisker plots.


