Curated OER
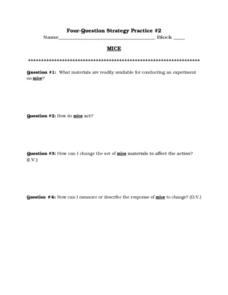
Four-Question Strategy Practice #2
In this experimental design worksheet, students brainstorm on an experiment to do with mice. They identify the materials available, the hypothesis and the independent and dependent variables.
Curated OER
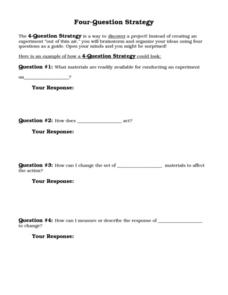
Four Question Strategy
In this experimental design worksheet, students brainstorm about a project to do on the topic of their choice. They answer four questions about the materials available, the hypothesis of their experiment and the independent and dependent...
Curated OER
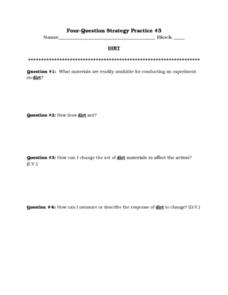
Four-Question Strategy Practice #3
In this experimental design worksheet, students answer four questions about an experiment on dirt. They include the materials available for the experiment, the hypothesis, and the independent and dependent variables.
Curated OER
Where do Plants Get their Food?
In this where do plants get their food worksheet, young scholars design an experiment that will disprove the idea that plants obtain their food from soil. Students will set up their experiment and design a data table that will record...
Curated OER
Data Analysis
In this data analysis worksheet, 8th graders solve and complete 4 different problems that include determining the line of best fit for each. First, they write the prediction for an equation for each situation described. Then, students...
Curated OER
The Methods of Biology
In this biology methods activity, students will explore the scientific method, including creating a hypothesis and setting up an experiment. This activity has 3 short answer questions, 5 matching questions, and 8 fill in the blank...
Curated OER
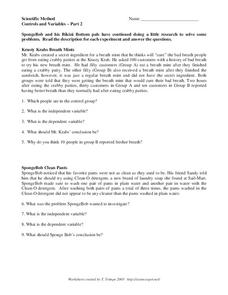
Scientific Method
In this Scientific Method worksheet, students identify controls, variables and conclusions given experiment descriptions. Students interpret data given in charts.
Curated OER
Use Scientific Method to Solve Problems
Students are given a set problem, they use the scientific method to solve the problem using all steps of the scientific research. Students list the steps of the scientific method used in solving a problem. They are given a selected...
Curated OER
Mechanical Properties
Students explore the concept of hardness. In this physical science lesson plan, students will be using clay heated at different temperatures to study hardness based on the indention left. Students will also be identifying the variables...
Curated OER
Making Connections
In this experimentation worksheet, students review the steps of setting up an experiment, determining the correct procedure and analyzing the data. This worksheet has 23 fill in the blank questions.
Curated OER
Weather Experiment Plan
In this weather experiment activity, students design an experiment that allow them to experiment a phenomenon of weather. Students identify the independent and dependent variable for their experiment. Students list the procedures as well...
Curated OER
The Circumference and Diameter of a Circle
Ninth graders investigate the finding of the diameter of a circle in order to extend the practice towards finding the circumference. They differentiate between the distance measured across a circle from that of around the perimeter.
Curated OER
Discovering Albedo
Pupils read a thermometer accurately, collect and record data, and generate a graph based on data. They learn what independent and dependent variables are. They analyze data and make conclusions concerning how soil coverings affect soil...
Georgia Department of Education
Ga Virtual Learning: Causation
In this comprehensive interactive tutorial you will learn about cause and effect in disease occurrence.
Shodor Education Foundation
Shodor Interactivate: Lesson: Introduction to Functions
Input numbers into the function machine and explore independent and dependent variables.
Science Education Resource Center at Carleton College
Serc: Investigating Motion: Calculating and Graphing Students Walking Speed
In this activity students will collect and analyze data of their walking speed. They will compare their speed to an outside speed walker. They will determine their speed every 20 meters up to 100 meters. They will complete five trials to...
Rice University
Hyper Stat Online Statistics Textbook: Trend Analysis
A series of pages that help us understand testing one or more components of a trend using specific comparisons, a set of coefficients, error analysis of variance and the probability value.
Texas A&M University
Wtamu Virtual Math Lab: Intermediate Algebra
This site is a tutorial for students in algebra 2 or for those who need a refresher. The site has explanations, definitions, examples, practice problems and practice tests are found covering topics such as linear equations, graphing,...
Rice University
Hyper Stat Online Statistics Textbook: Four Basic Statistics Variables
The basic definitions of four statistics variables - quantitative, qualitative, dependent and independent - are provided here.
Vassar College
Vassar College: Multiple Regression
This is an interactive site allowing the student to input data (one dependent and three independent variables) and then letting the computer calculate the regression between these multiple forces.
CK-12 Foundation
Ck 12: Scientific Method
[Free Registration/Login may be required to access all resource tools.] Describe how the Renaissance period in history changed the approach to science. Identify the steps of the scientific method. Differentiate between the independent...
TeachEngineering
Teach Engineering: Cars: Engineering for Efficiency
Students learn how the aerodynamics and rolling resistance of a car affect its energy efficiency through designing and constructing model cars out of simple materials. As the little cars are raced down a tilted track (powered by gravity)...
CK-12 Foundation
Ck 12: Biology: Science Experiments
[Free Registration/Login may be required to access all resource tools.] Covers the scientific experimental design.
US Department of Education
National Center for Education Statistics: Create a Graph Tutorial
This tutorial walks students through how to create different types of graphs using the Create a Graph tool available on the website. Covers bar graphs, line graphs, pie charts, area graphs, scatter plots, and dependent and independent...


