Curated OER
Aruba Cloud Cover Measured by Satellite
Students analyze cloud cover and compose written conclusions to a given related scenario. Students submit a letter of response and a report detailing their calculations and conclusions.
Curated OER
Weather Conditions
In this weather conditions learning exercise, students use a month of recorded weather conditions to create a graph comparing the number of days it was cloudy, raining, or clear. This learning exercise has a graphic organizer and a graph.
Curated OER
Weather Data - Percentages
In this weather learning exercise, students calculate the percentage of weather conditions recorded over a month at three different locations. This learning exercise has 12 problems to solve.
Curated OER
Seasonal Cloud Cover Variations
Learners, in groups, access data from the NASA website Live Access Server regarding seasonal cloud coverage and the type of clouds that make up the coverage. They graph the data and make correlations between types, seasons and percentages.
Curated OER
Weather Report Chart
Students complete a weather report chart after studying weather patterns for a period of time. In this weather report lesson, students measure temperature, precipitation, cloud cover, wind speed, and wind direction for a month. Students...
Curated OER
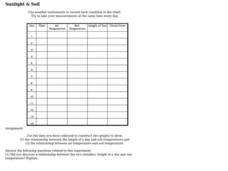
Sunlight & Soil
In this earth science worksheet on sunlight and soil, students use data collected in a chart to construct two graphs. Following, they answer five questions as they relate to the experiment performed.
Curated OER
Aruba Cloud Cover Measured by Satellite
Students analyze cloud cover over Aruba. They compose and submit written conclusions which include data, analysis, errors in data collection, and references.
Curated OER
Piece of the Sky: Introduction for Making S'COOL Observations
Students observe and discuss cloud cover. They identify percent of cloud cover, calculate cloud cover by fraction and convert to a percent, and compare their models with the current real sky cloud cover.


