Curated OER
Frequency Tables; Discrete Ungrouped Data
In this frequency tables worksheet, students utilize given data to work out three frequency charts with one containing values and a pie chart involving angles for each value. Students complete three vertical line diagrams and check all...
Curated OER
Hand Sensitivity
Students experiment with the sense of touch. In this tactile instructional activity, students determine the most sensitive area of the hand. Students experiment by describing objects through touch only. Students compare the amount of...
Curated OER
Collecting Data
In this algebra worksheet, students collect and analyze data. They graph and identify their solutions. There is one question with an answer key.
Curated OER
Graph Those Stickers!
Students graph fruit. In this graphing lesson students create a graph using fruit label stickers. Students place a sticker on the graph when the fruit has been consumed.
Curated OER
Think Science - Collecting Data
In this data collection worksheet, students collect data about butterflies and milkweed plants and record the measurement tools they use to collect it. Students complete 2 columns.
Curated OER
Count on Math
Students develop number sense up to a million. In this developing number sense up to a million lesson, students count their breaths in given time span. Students use blocks representing 10's and 100's to create a...
Curated OER
Graphing Conversation Hearts
Students collect data and create a graph. In this mathematics lesson, students separate paper hearts by color and create a graph showing the number of hearts of each color present. Students receive a handful of candy hearts that...
Curated OER
Months of the Year
Young scholars practice interviewing. In this months of the year lesson, students interview at least five adults working in their school to gather data on when their birthdays occur. Young scholars create a master calendar for the...
Curated OER
Dental Arithmetic: Sugar Clocks
Students analyze data about their teeth. In this data collection lesson, students determine how often their teeth should be brushed during the day. Students also estimate the amounts of sugar in 17 foods.
Curated OER
Surveys and Samples
In this surveys and samples worksheet, students discover data collection techniques and write their own survey questions. Students use random sampling, convenience sampling, and systemic sampling and analyze their results.
Curated OER
Handling Data: Collecting and Recording Data
Students collect and record data. In this collecting and recording data activity, students collect data and record that data using frequency tables which include the x and y axis.
Curated OER
Canada Recycles! Do You?: Grades 4-6
In this recycling education activity, students read a table regarding Canadian recycling statistics and respond to 9 questions regarding the data.
Curated OER
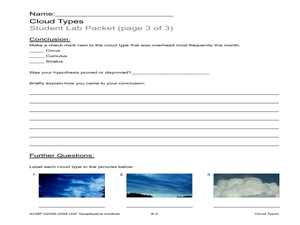
Cloud Types
Students examine cloud types. In this cloud lesson, students identify cloud types, observe clouds and collect data, and analyze data to identify the most common cloud they observe overhead during the course of a month.
Curated OER
Critter Encounter Chart
Students record data found at an assigned web site. In this data collection lesson, students access an assigned web site in order to complete a data chart about animals they see. They travel to different sections of the web site to find...
Curated OER
Data Collection - Primary Poster
Students explore the concept of collecting, analyzing, and graphing data. In this collecting, analyzing, and graphing data lesson plan, students create a survey about a topic of interest. Students poll their classmates, analyze, and...
Curated OER
Questionnaires and Analysis
In this questionnaires and analysis worksheet, students design a questionnaire and then select a sample. They organize and analyze data. This four-page worksheet contains 1 multi-step problem. Explanations and examples are provided.
Curated OER
My Favorite Things
In this favorite things worksheet, students practice their printing skills as they respond to 3 questions about their favorite things. Students also interview classmates regarding their favorite fruits, sports, and weather.
Curated OER
Gingerbread Man Math
Students collect and explore gingerbread man data. In this math and technology lesson plan, students examine how to organize and interpret data in three formats: objects, pictures, and graphs.
Curated OER
Cereal Box Blocks and More!
Young scholars sort and categorize different types of boxes and cartons. In this sorting lesson, students designate areas of the room to put different sizes, styles, or colors of boxes. They help their teacher count and graph the...
Curated OER
Collect and Organize Data: Homework
In this collecting and organizing data instructional activity, students use the tally chart for the students' eye color to answer the first two questions. Students then survey their family for eye color, record those results in a tally...
Curated OER
Changing State
Learners investigate the cooling and heating of water. In this online science experiment lesson, students work in groups to make predictions regarding freezing and boiling points and then test those predictions as they complete the...
Curated OER
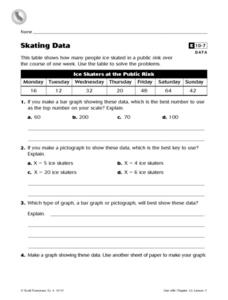
Skating Data
In this collecting data worksheet, 4th graders view a table on ice skaters at a public rink in order to answer 2 multiple choice questions, 1 short answer question and make a graph showing one piece of the data.
Curated OER
Collecting Data
In this data collection worksheet, students read about how data is collected and organized. They also learn about a hypothesis. Students read through examples of different charts and then answer 23 questions pertaining to data...
Curated OER
Collecting And Organizing Data
In this collecting and organizing data worksheet, students, with a partner, problem solve and calculate the answers to six mathematical word problems.


