Better Lesson
Better Lesson: Representing Our Own Surveys
After developing a survey questions and polling their classmates (in yesterday's lesson), 1st graders will now find a way to represent their findings and write a statement about what they noticed.
Better Lesson
Better Lesson: Representations of Data
Stop! It's Data Time. Every time your read me from the left or the right. It's the numbers on the board, that make the data right. Students take part in a quick survey to start the lesson and then continue to work on their data...
Alabama Learning Exchange
Alex: Weather Detectives
This is an introductory lesson to a second grade weather unit. The students will be observing the weather each day for one week and recording their observations in a chart. The students will be integrating information from the Internet...
E-learning for Kids
E Learning for Kids: Math: Olive Trees: Data & Chance
Ariel is taking a survey. Do you want to help her collect and describe data?
Math Slice
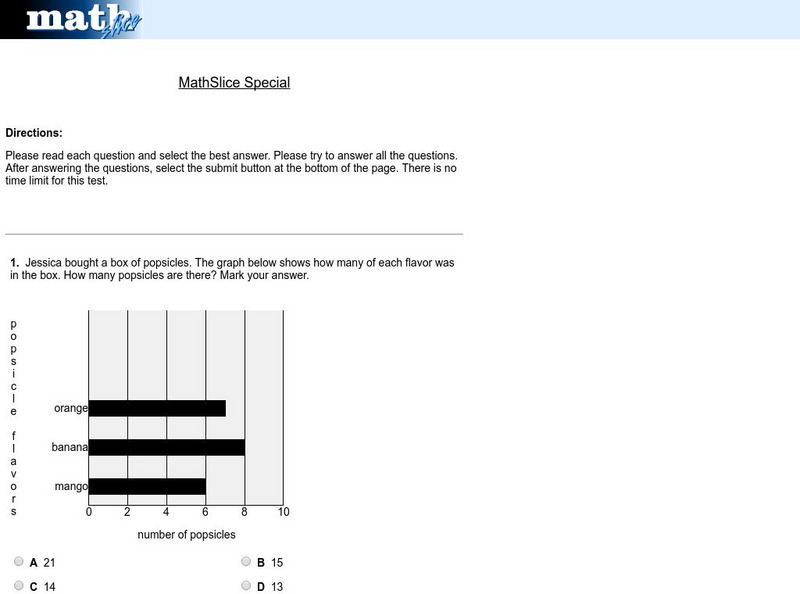
Math Slice: Chart Slice Special Test
A ten question test assessing data collection and analysis skills with bar graphs. Assessment is scored online. An excellent tool for assessment.
Houghton Mifflin Harcourt
Houghton Mifflin Harcourt: Saxon Activity Center: Real World Investigation: Elevation Changes [Pdf]
Math and geography are the focus of this internet investigation. Learners must plan a road trip to several cities and plot the elevations of those cities using a line graph. Acrobat Reader required.
Sophia Learning
Sophia: Why Collect Data: Lesson 2
This lesson will discuss and explain why we collect data. It is 2 of 5 in the series titled "Why Collect Data."
Sophia Learning
Sophia: Why Collect Data: Lesson 3
This lesson will discuss and explain why we collect data. It is 3 of 5 in the series titled "Why Collect Data."
Sophia Learning
Sophia: Why Collect Data: Lesson 5
This lesson will discuss and explain why we collect data. It is 5 of 5 in the series titled "Why Collect Data."
Science and Mathematics Initiative for Learning Enhancement (SMILE)
Smile: Lesson Plan: Scientific Method "The Big Ahah"
This lesson plan helps students understand and use the scientific method. It also helps helps students understand the importance of good scientific experimentation to the scientific method.
National Council of Teachers of Mathematics
Nctm: Figure This: How Many Colors of States Are on a Us Map
Try this data collection and analysis math challenge on map coloring. An interesting approach to analyzing complex data. This one page activity is part of the NCTM Math Challenges for Families collection.
Books in the Classroom
Carol Hurst's Children's Literature Site: Data Gathering and Analyzing
Carol Hurst provides this sample chapter from "Picturing Math." Gathering data is a frequent part of solving problems and satisfying curiosity, which includes working with graphs and using mathematical tools such as averaging and other...
Rice University
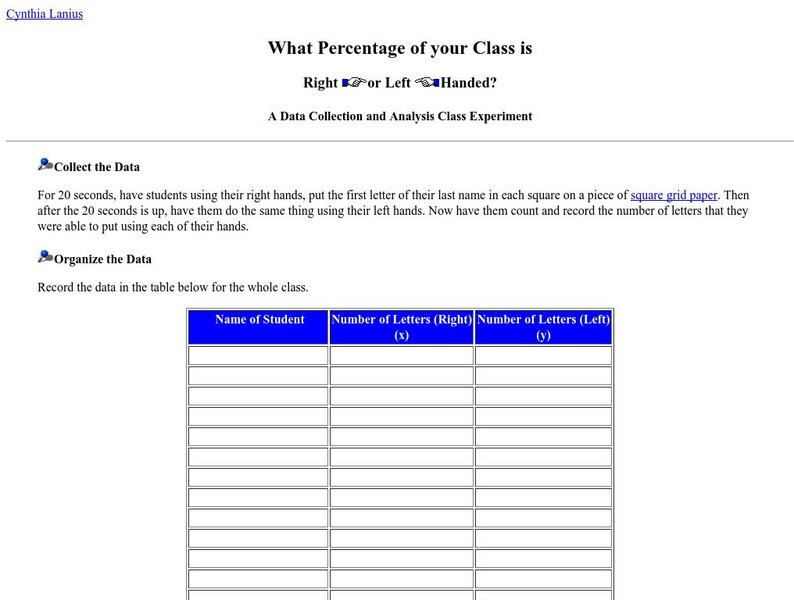
What Percentage of Your Class Is Right or Left Handed?
What percentage of the class is right or left-handed? Students will investigate this question using statistical processes of collecting the data, organizing it, graphing, and finally analyzing it. Follow-up questions are provided for the...
Rice University
Rice University: The Hand Squeeze
Students will enjoy this data collection and class analysis experiment involving the time it takes for a hand squeeze to travel around a circle of people. From organizing the activity to collecting the data to making a table and graphing...
Shodor Education Foundation
Shodor Interactivate: Probability
Students learn about probability by predicting the outcome of planned experiments and playing racing games.
McGraw Hill
Glencoe: Collecting and Analyzing Data Quiz
This site is a quiz with five quick questions to check your understanding of how to collect and analyze data. It is self checking.


