Curated OER
Music and Sports
With so much talent in the classroom, do your musicians and athletes have related interests? This problem has your learners taking data from their classmates to decide whether there is an association between the two activities. The...
Curated OER
Estimate and Compare Data
Seventh graders explore the values that are used in order to describe data that is collected or given. They compare data using the statistical analysis provided by finding the mean, median, and range.
Curated OER
Exploring Biomes Lesson 3: Endangered Biomes
Future environmental scientists compare data from two different conservation strategies. Alone this lesson is sufficient, but as part of the Exploring Biomes unit produced by the Arizona Fish and Game Department, it becomes top-notch.
National Council of Teachers of Mathematics
The Math Forum: Exploring Ocean Data Lesson Plan
Find "oceans of data" for students of all ages. NCTM, California, and Philadelphia standards are listed for each grade level along with lesson plans and other website resources.
Texas Instruments
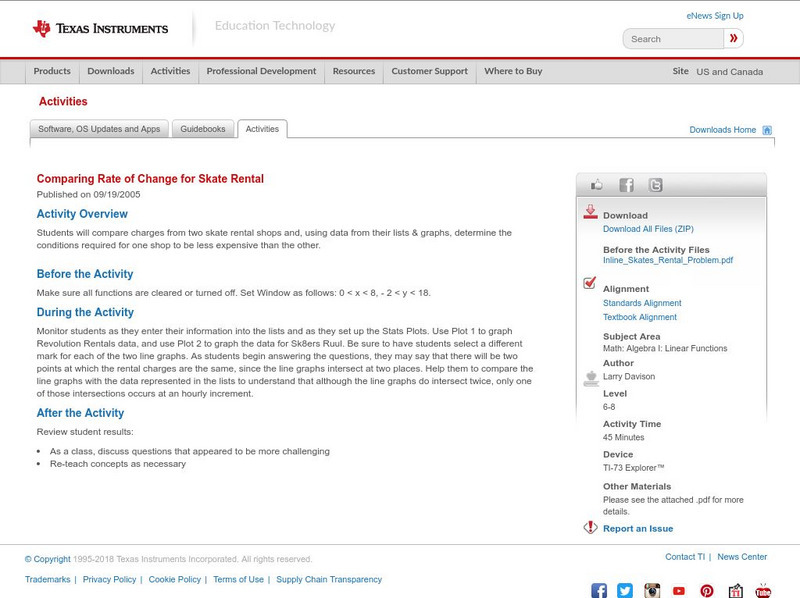
Texas Instruments: Comparing Rate of Change for Skate Rental
Students will compare charges from two skate rental shops and, using data from their lists & graphs, determine the conditions required for one shop to be less expensive than the other.
PBS
Pbs Mathline: Button, Button Lesson Plan [Pdf]
An integrated math and language arts activity focusing on statistics. Young scholars explore the concepts of estimation, data collection, data analysis, classification, graphing, and counting through the reading of the Button Box by...
National Council of Teachers of Mathematics
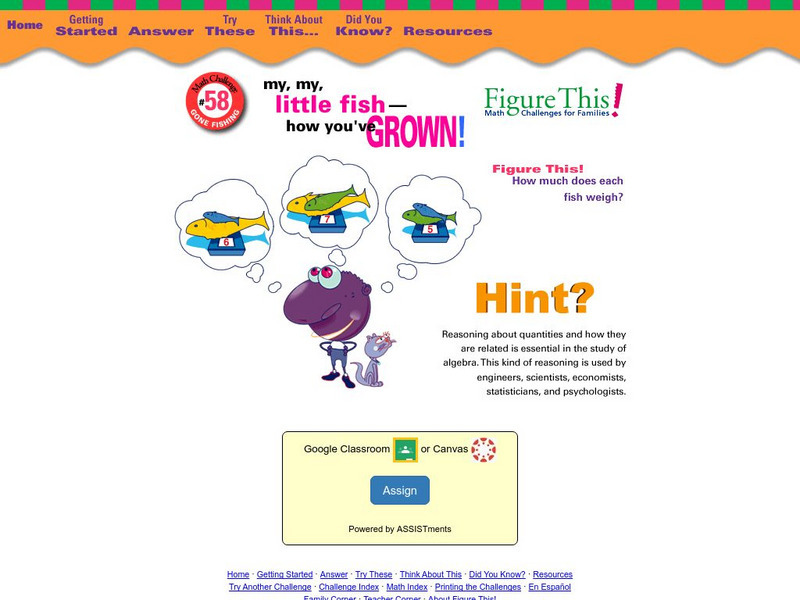
Nctm: Figure This: Gone Fishing (Pdf)
Use your algebraic reasoning to solve this math challenge that explores the relationship between quantities and weights. Try this math challenge from the NCTM Math Challenges for Families series. Also, discover how mastering this skill...
National Council of Teachers of Mathematics
Nctm: Figure This: Does It Make a Difference Where You Shop?
A math investigation that uses scatter plots to compare prices of favorite soft drinks. Discover how valuable your skills in organizing and displaying data can be in real life scenarios.
PBS
Pbs Mathline: Whirlybirds [Pdf]
This engaging lesson combines the concepts of statistics and measurement. Learners create a simulation of a parachute jump using whirlybirds, to predict the frequency of an event occurring. A detailed lesson plan which includes a list of...
Houghton Mifflin Harcourt
Houghton Mifflin Harcourt: Saxon Activity Center: Real World Investigation: Elevation Changes [Pdf]
Math and geography are the focus of this internet investigation. Learners must plan a road trip to several cities and plot the elevations of those cities using a line graph. Acrobat Reader required.
McGraw Hill
Glencoe: Using Graphs to Understand Data Quiz
This is a quiz with five quick questions to check your knowledge of how to use graphs to understand data. It is self-checking.
McGraw Hill
Glencoe: Collecting and Analyzing Data Quiz
This site is a quiz with five quick questions to check your understanding of how to collect and analyze data. It is self checking.


![Pbs Mathline: Button, Button Lesson Plan [Pdf] Lesson Plan Pbs Mathline: Button, Button Lesson Plan [Pdf] Lesson Plan](https://d15y2dacu3jp90.cloudfront.net/images/attachment_defaults/resource/large/FPO-knovation.png)


