World Wildlife Fund
Bar Charts & Pie Charts
Learn about life in the Arctic while practicing how to graph and interpret data with this interdisciplinary lesson plan. Starting with a whole group data-gathering exercise, students are then given a worksheet on which they analyze and...
Curated OER
College Athletes
When more basketball players are taller than field hockey players at a school, is it safe to say that in general they are always taller? The activity takes data from two college teams and your learners will be able to answer questions...
Curated OER
Valentine's Day Ordering and Comparing
After a lesson on tables and charts, learners can practice their data-reading skills by comparing how many Valentine's cards Heather received and gave out over the last few years. Additionally, students can practice their "greater than"...
Curated OER
Graphing with the Five Senses
Students collect data and record it on a bar graph. In this data graphing lesson, each small group of students is assigned to collect data on one of the five senses. They then practice a song that helps them remember the purpose of each...
Curated OER
Telephone Time
In this telephone time worksheet, students study, discuss and compare two sets of data when represented on the same graph. Students set up an original graph.
Other
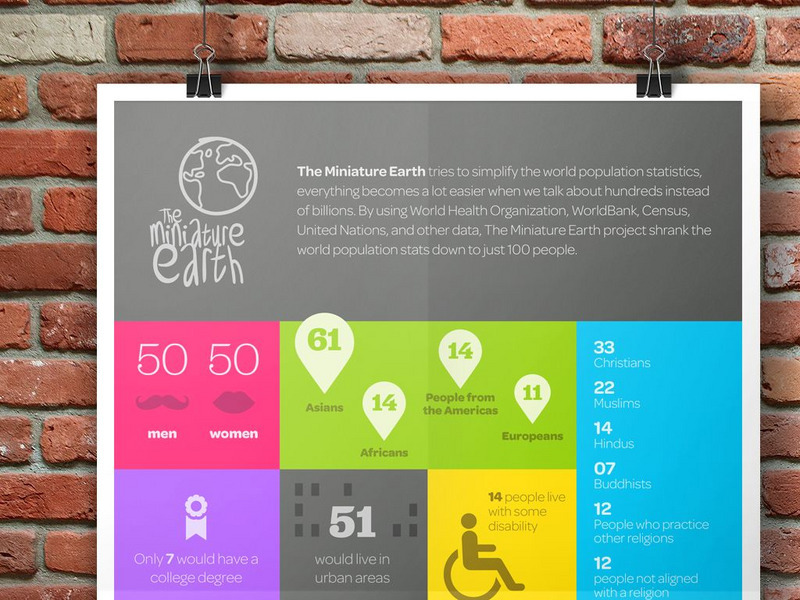
Miniature Earth: Comparative Demographics Worldwide
Miniature Earth reduces the world's population to 100 to underscore the dramatic differences in wealth, age, faith, education, environment, and health among people who live on this planet. An excellent apply-what-you-know site for...
Other
A River Runs Through It Learning Project
In this year long learning project integrating mathematics and science, students solve environmental problems using data collection and problem solving concepts. Designed for upper elementary gifted students. Interactive components and...
Center for Innovation in Engineering and Science Education, Stevens Institute of Technology
Ciese: Collaborative Projects
Using a variety of science topics, these projects link your class with classes around the world in data collection and analysis. There are projects recommended for all grade levels. Begin dates and end dates are listed to help in...
National Council of Teachers of Mathematics
The Math Forum: Seventh Grade Mathematics: Data Sense
This site has some interesting ways to collect and evaluate data. There are some activities about note taking, spreadsheets, surveys, and a cool bridge construction project. Teachers may want to use this site as a resource for some...
University Corporation for Atmospheric Research
Ucar: Project Sky Math
Teachers will be interested to explore the SkyMath module, and the 16 classroom activities at this site. In this program, students will collect and record real-time weather data to analyze. Data analysis, graphing, number relationship,...
Texas Instruments
Texas Instruments: Light at a Distance: Distance and Light Intensity
In this activity, students can use a light sensor to record the light intensity at various distances from a bulb. They will compare the data to an inverse square and a power law model.
Texas Instruments
Texas Instruments: Overdue Fines
In this activity, students learn to solve a real-world problem comparing overdue fines at different libraries.
Texas Instruments
Texas Instruments: Are Your Bones Normal?
Students can use the TI-Navigator to investigate mathematics in Forensic Science.
Texas Instruments
Texas Instruments: How Fast Are You?
Use the Data/Graphs Wizard tool in the SciTools App to compare the averages of four sets of data.
Texas Instruments
Texas Instruments: This Is for the Birds!
This activity enables students to practice various skills such entering lists, comparing data, and utilizing statistical terms on the graphing calculator.
PBS
Pbs Lesson Plan: Chances Are Talking Probability (Pdf) [Pdf]
An introductory lesson in probability for students in grades three to five. The concepts presented in this lesson are interwoven, over time, into a current unit of study. Students examine closely the "language" of probability as used in...
Other
Global Grocery List Project: Homepage
At this site from the Global Grocery List Project, students collect data on the prices of common grocery items and submit their findings. They can then compare the data they collected to data from students around the world. There are...
Mangahigh
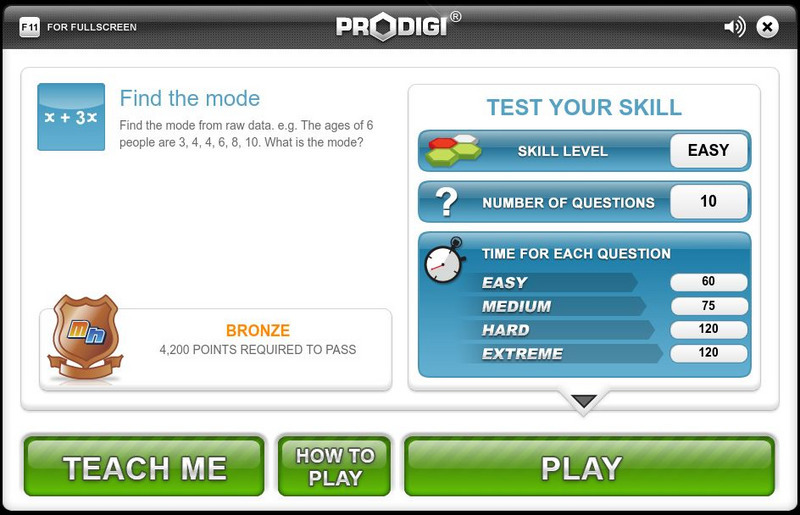
Mangahigh: Data: Find the Mode
Students learn about the concept of mode by exploring a tutorial. They can then test their knowledge by taking a ten question assessment that increases in difficulty as they correctly answer questions.
Mangahigh
Mangahigh: Data: Find the Class Interval Containing the Mode
Students watch an online tutorial on the concept of finding mode from a frequency table. After watching, students test their knowledge by attempting ten practice problems that increase or decrease in difficulty based on their answers.
Mangahigh
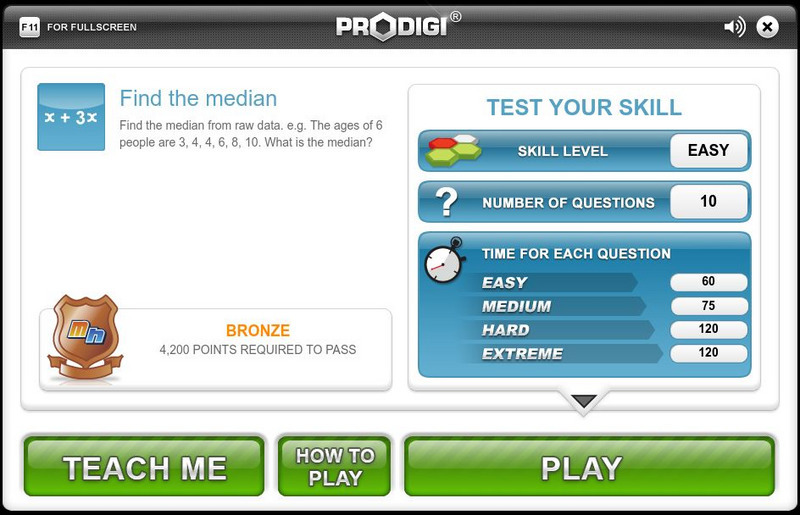
Mangahigh: Data: Find the Median
Students learn about the concept of median by exploring a tutorial. They can then test their knowledge by taking a ten question assessment that increases in difficulty as they correctly answer questions.
Mangahigh
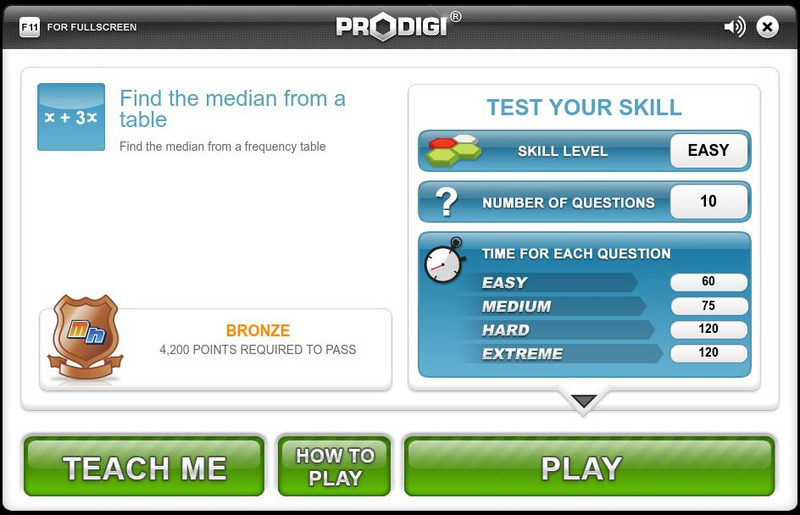
Mangahigh: Data: Find the Median From a Table
Students learn about the concept of median by exploring a tutorial. They can then test their knowledge by taking a ten question assessment that increases in difficulty as they correctly answer questions.
Mangahigh
Mangahigh: Data: Find the Class Interval Containing the Median
Students watch an online tutorial on the concept of finding the median. After watching, students test their knowledge by attempting ten practice problems that increase or decrease in difficulty based on their answers.
Mangahigh
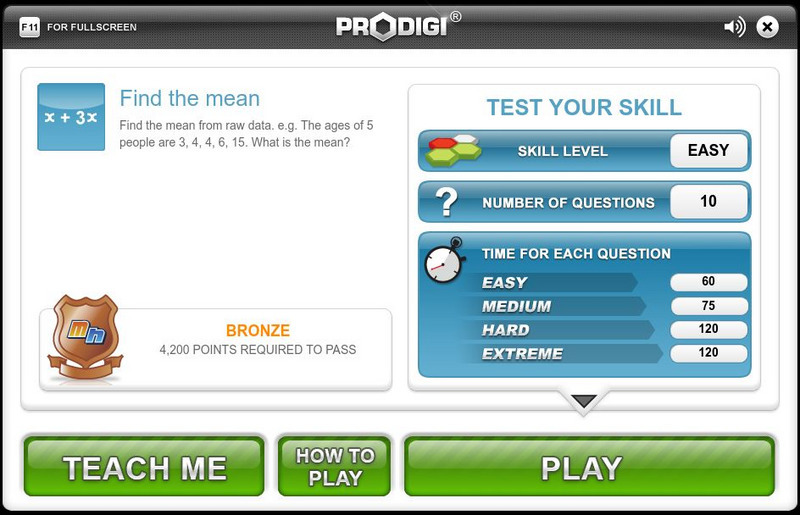
Mangahigh: Data: Find the Mean
Students learn about the concept of mean by exploring a tutorial. They can then test their knowledge by taking a ten question assessment that increases in difficulty as they correctly answer questions.
Mangahigh
Mangahigh: Data: Find the Mean From a Table
This site provides students practice with the concept of finding the mean. Students can learn about the topic by completing an interactive tutorial. Students can then take a ten question timed test to practice the skill.




![Pbs Lesson Plan: Chances Are Talking Probability (Pdf) [Pdf] Unknown Type Pbs Lesson Plan: Chances Are Talking Probability (Pdf) [Pdf] Unknown Type](https://d15y2dacu3jp90.cloudfront.net/images/attachment_defaults/resource/large/FPO-knovation.png)

