Mangahigh
Mangahigh: Data: Estimate the Mean Using Grouped Results
Students watch an online tutorial on the concept of estimating the mean. After watching, students test their knowledge by attempting ten practice problems that increase or decrease in difficulty based on their answers.
Mangahigh
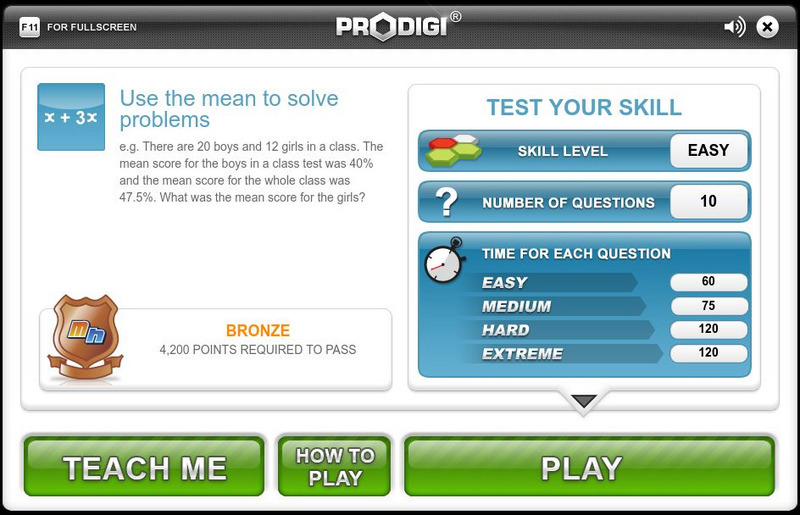
Mangahigh: Data: Use the Mean to Solve Problems
This site provides students practice with the concept of mean. Students can learn about the topic by completing an interactive tutorial. Students can then take a ten question timed test to practice the skill.
Mangahigh
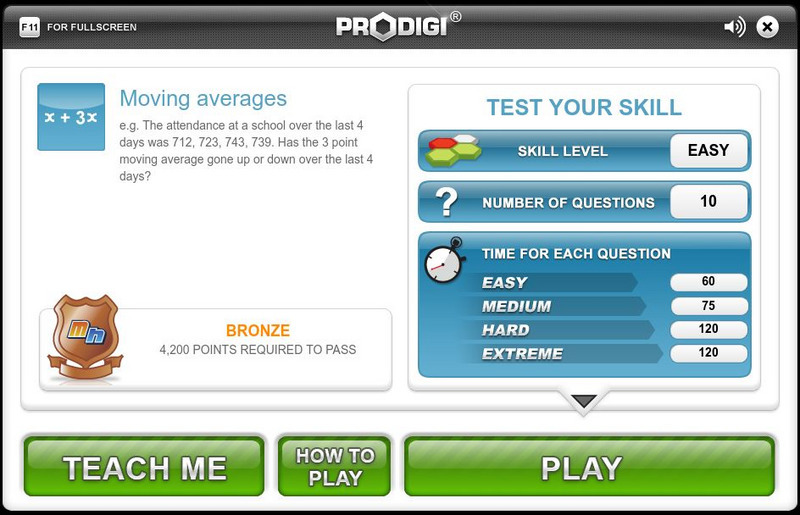
Mangahigh: Data: Moving Averages
Students watch an online tutorial on the concept of moving averages. After watching, students test their knowledge by attempting ten practice problems that increase or decrease in difficulty based on their answers.
Mangahigh
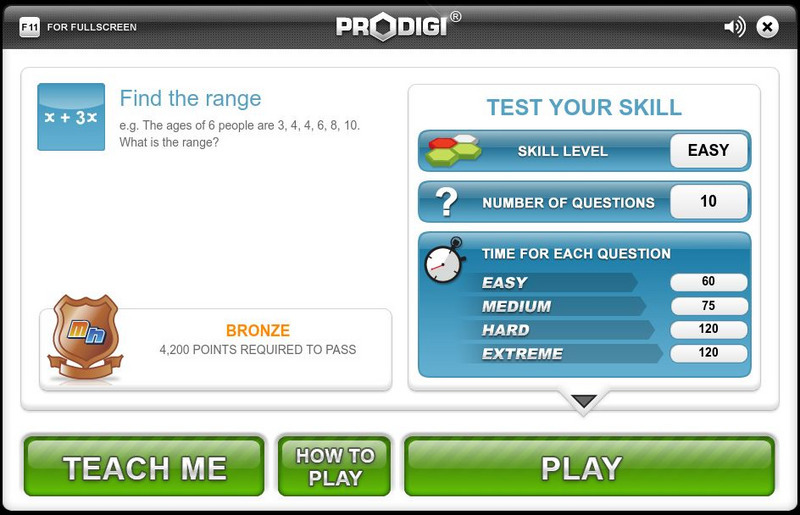
Mangahigh: Data: Find the Range
Students learn about the concept of range by exploring a tutorial. They can then test their knowledge by taking a ten question assessment that increases in difficulty as they correctly answer questions.
National Council of Teachers of Mathematics
Nctm: Figure This: Does Drinking Soda Affect Your Health?
Try this "Real world," challenge taken directly from the today's health journals. Use your problem solving, data analysis, and number sense skills to figure out if soda intake among teenage girls is related to incidences of broken bones....
Texas Instruments
Texas Instruments: Describing Categorical Data
Students analyze the distribution of categorical data. They calculate percents and visually compare the data sets with a bar chart.
National Council of Teachers of Mathematics
Nctm: Figure This: Do Women Live Longer Than Men?
Use this site to figure out if women really do live longer than men. A math challenge taken from today's health journals that explores data collection, data analysis, patterns, and graphing skills. Learn how mastering these skills can be...
Texas Instruments
Texas Instruments: Let's Play Ball With Box and Whisker Plots
This activity is designed to help students make decisions about what and how information could be displayed graphically. The data set deals with salaries of professional baseball players. It is designed for students to determine if the...
National Council of Teachers of Mathematics
Nctm: Comparing Properties of the Mean and Median
Through the use of technology, students can investigate how the mean and median of a set of date compares when values the data changes.
Science and Mathematics Initiative for Learning Enhancement (SMILE)
Smile: Lesson: An Introduction to Estimation and Measurements
Pancakes anyone? Pupils explore estimation and measurement by learning how to make pancakes. A hands-on lesson designed for students in grades 3-5 where pupils are engage in hand-on experiences involving measuring volume, converting...
Math Slice
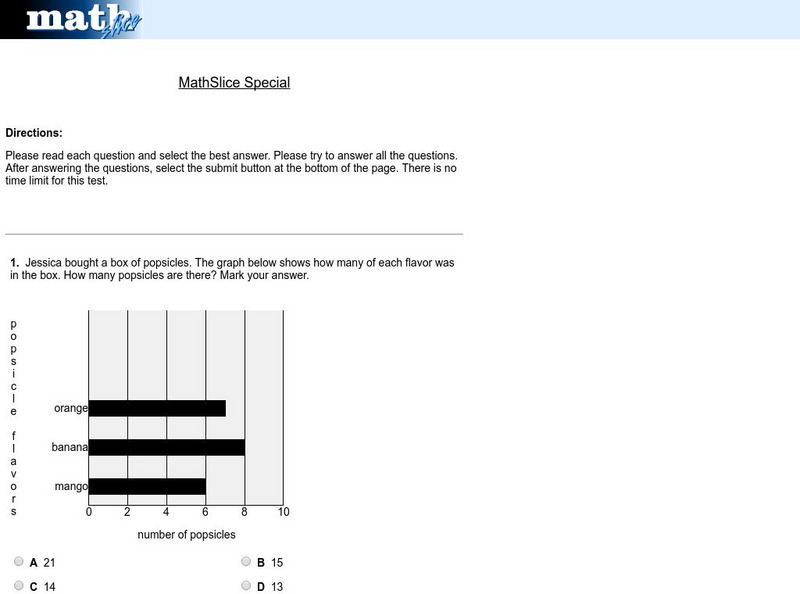
Math Slice: Chart Slice Special Test
A ten question test assessing data collection and analysis skills with bar graphs. Assessment is scored online. An excellent tool for assessment.
National Council of Teachers of Mathematics
Nctm: Figure This: Who's on First Today?
Batter up! Who has the higher batting average, Joe McEwing or Mike Lieberthal? Try your computation and averaging skills in this real-world math challenge. Learn how sharpening your averaging skills can be valuable in real life...
National Council of Teachers of Mathematics
Nctm: Figure This: Tv Ratings (Pdf)
Here's a challenge for the avid TV watcher. Use your data interpretation skills to explore America's TV watching habits in this NCTM Math Challenges for Families activity. See if you can figure out which night of the week has the...
National Council of Teachers of Mathematics
Nctm: Figure This: Animal Ages
An investigation for the animal lovers that focuses on measurement conversion, data analysis, and calculating growth rates.
National Council of Teachers of Mathematics
Nctm: Figure This: How Many Colors of States Are on a Us Map
Try this data collection and analysis math challenge on map coloring. An interesting approach to analyzing complex data. This one page activity is part of the NCTM Math Challenges for Families collection.
National Council of Teachers of Mathematics
Nctm: Figure This: Grape Juice Jungle
Are all juice grape juice concentrates the same? Find out when you explore ratio and fractions in this math challenge that compares juice recipes to identify strongest taste. A one page activity from the NCTM Math Challenges for Families...


