Curated OER
Organizing Data
In this organizing data worksheet, 7th graders solve seven different types of problems related to data. They first identify the type of data as categorical, discrete or continuous from the information given. Then, students use Excel to...
Curated OER
Data Collection and Presentation
Students concentrate on discrete quantiative data. They are shown that the vertical line diagram as a more appropriate way to present discrete quantiative data then bar charts. Students work as a group to help with the interpretation...
Google
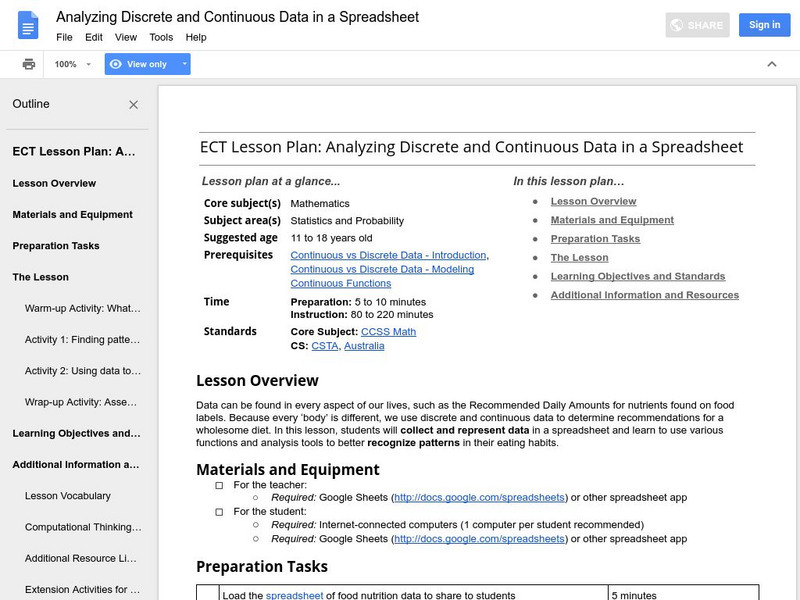
Google for Education: Applyng Discrete and Continuous Data in a Spreadsheet
Students collect data in a spreadsheet and learn to use various functions and analysis tools to better see patterns in their eating habits.
Google
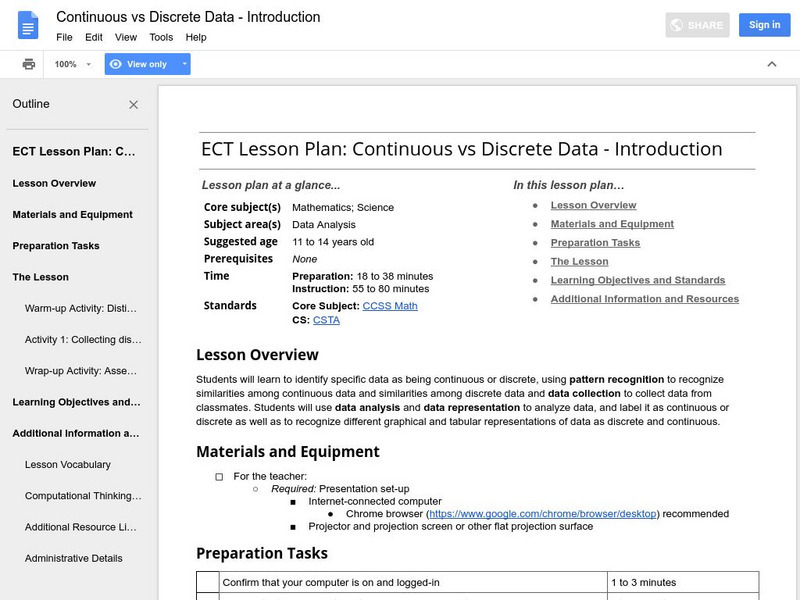
Google for Education: Continuous vs Discrete Data
When working with data, it is important to know whether it is continuous or discrete, as this will determine what calculations can be applied and what information can be extracted from it. Here, students to distinguish between continuous...
Cuemath
Cuemath: Discrete Data
A comprehensive guide for learning all about discrete data with definitions, the difference between discrete and continuous data, graphical representation of discrete data through visualization, solved examples, and interactive questions...
University of Illinois
University of Illinois: Data Types
The University of Illinois provides this site that is helpful because of the various kinds of data that can be collected. This lesson plan helps students differentiate between qualitative, quantitative, and many other types of data.
Other
Rutgers Marine & Coastal Sciences: Cool Classroom
Students and teachers can explore the work of marine scientists and observe the ocean from their computers. Learn about Rutgers Coastal Ocean Observation Laboratory, discover why oceanography is important, and see what life is like in...
Mangahigh
Mangahigh: Data: Understand Discrete and Continuous Data
This site provides students practice with the concept of discrete and continuous data. Students can learn about the topic by completing an interactive tutorial. Students can then take a ten question timed test to practice the skill.
CK-12 Foundation
Ck 12: Probability: Discrete and Continuous Random Variables
[Free Registration/Login may be required to access all resource tools.] This Concept introduces students to discrete and continuous variables.
Sophia Learning
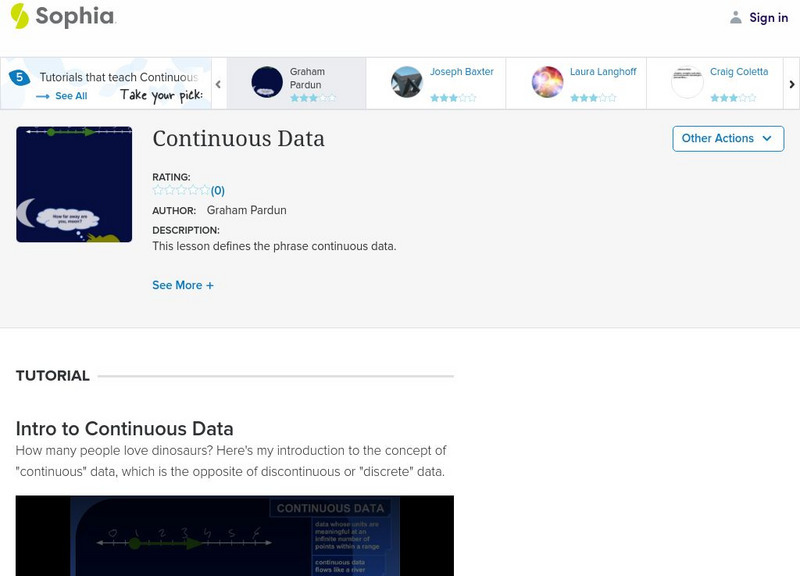
Sophia: Continuous Data Tutorial
Continuous data is defined and explained in this video.
Sophia Learning
Sophia: Continuous Data
Continuous data is defined and examples are given in this lesson.
Sophia Learning
Sophia: Continuous vs Discrete Data
Explore continuous and discrete data and when to use one over the other.
Sophia Learning
Sophia: Continuous vs Discrete Data
Explore continuous and discrete data and determine when to use each one.
CK-12 Foundation
Ck 12: Probability: Exponential Distributions
[Free Registration/Login may be required to access all resource tools.] Covers exponential distributions. Presents examples using a graphing calculator as well as guided and independent practice questions.
CK-12 Foundation
Ck 12: Statistics: Normal Distributions
[Free Registration/Login may be required to access all resource tools.] Determine if a data set approximates a normal distribution.
CK-12 Foundation
Ck 12: Basic Graph Types
[Free Registration/Login may be required to access all resource tools.] Students will review the different types of graphs, and the differences between discrete and continuous data, and between qualitative and quantitative data. They...
Rice University
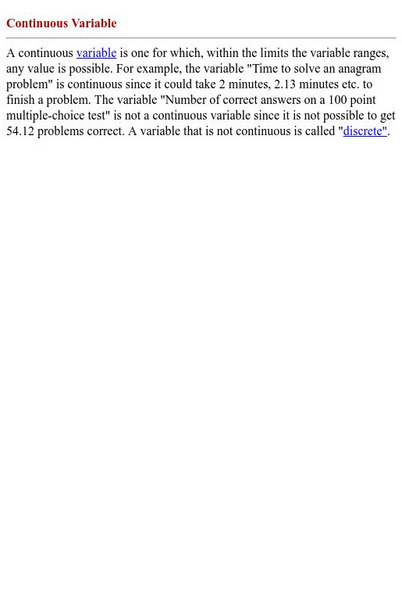
Hyper Stat Online Statistics Textbook: Continuous and Discrete Variables
The basic definitions of continuous and discrete statistics variables are provided here.
Sophia Learning
Sophia: Representing Data With Box and Whisker Plots
This lesson demonstrates how a box-and-whisker plot can be used to represent data.
Sophia Learning
Sophia: Representing With Box and Whisker Plots: Lesson 1
This lesson demonstrates how a box-and-whisker plot can be used to represent data. It is 1 of 3 in the series titled "Representing with Box-and-Whisker Plots."


