Curated OER
Contour Map Worksheet #2
Following a contour map of a hill, a stream, and the ocean, are five multiple choice questions. Earth science enthusiasts determine elevation, direction of water flow, distance, and steepness. They also match the map to a selection of...
Curated OER
Contour Map Worksheet #3
Earth scientists answer five multiple choice questions about the topographical map atop the worksheet. Use this as a quick assessment of understanding after having taught how to read contour lines and topographic maps.
Curated OER
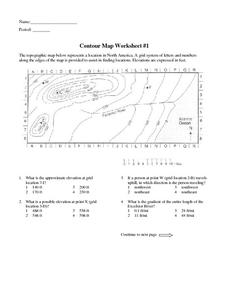
Contour Map Worksheet #1
Being able to read a topographic map is a standard in middle school earth science units and imperative for outdoor enthusiasts. As you introduce learners to this skill, you can assign this as an assessment or reinforcement. Pupils view a...
Curated OER
Mapping Ancient Coastlines
Most of this lesson is spent working on the "Bathymetry Worksheet." It includes a graph of the changes in sea level over the past 150,000 years and a bathymetric map of changes in an imaginary coastline over time. Participants answer...
Curated OER
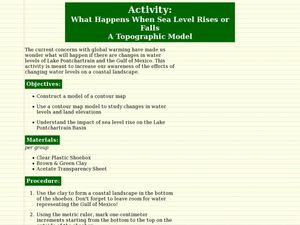
What Happens When Sea Level Rises or Falls
Learners examine the impact of sea level on land formations. In this geography and map instructional activity, students construct a contour map model illustrating how much of the clay "coastline" is covered as water is added. Metric...
Curated OER
Red River Contours
In this contour map instructional activity, students use a given contour map to answer 16 questions about the area shown on the map. Topics include the gradient from one spot to another, the elevation, the direction of the flow of the...
Curated OER
Topographic Maps
In this topographic map worksheet, young scholars learn how to read a topographic map and create a topographic map of their own using clay or Play-Doh. Students include contour lines by layering the clay. Young scholars answer 6...
Curated OER
Contour Map Worksheet #4
There are only four questions here. There is a contour map of Cottonwood, Colorado and the creek that crosses it. Earth scientists tell in what direction the creek flows, identify the highest elevation on the map, draw a topographic...
Curated OER
Cross Section and Slope
Students draw cross sections of given contour maps. In this math lesson, students interpret the different symbols used in the map. They determine slope and steepness through direct measurement.
Curated OER
Contour Map
For this contour map worksheet, learners create 3 different contour maps by highlighting all the data points with the same value and connecting the dots.
Curated OER
Sonar Mapping
Students use a shoe box to create a seafloor model and use cardboard for layering inside of the shoe box to simulate the ocean floor. They probe the ocean floor to simulate sonar echoes. Finally, students graph their data to get a...
Curated OER
Vocabulary for Dimensions of the Earth
In this Earth dimensions worksheet, students define 24 terms associated with contour maps, latitude, longitude, and time zones.
Geographypods
Geographypods: Map Skills
A collection of highly engaging learning modules on various topics within mapping skills. Covers map symbols, how to use four- and six-figure grid references, cardinal directions, distance, contour mapping, and drawing cross-sections....
Science Education Resource Center at Carleton College
Serc: Investigating Contour Maps: Creating Contour Maps by Surveying
In this activity, the students will understand how contour maps are created and appear the way that they do by using various materials to create and compare contour lines of different elevation levels.


