Texas Instruments
Texas Instruments: Creating Charts
Students learn to represent data in a list as a bar chart. They examine statistics from the 2000 Olympic Games and determine the team that took home the most medals.
University of Cambridge
University of Cambridge: Nrich: Cross Country Race
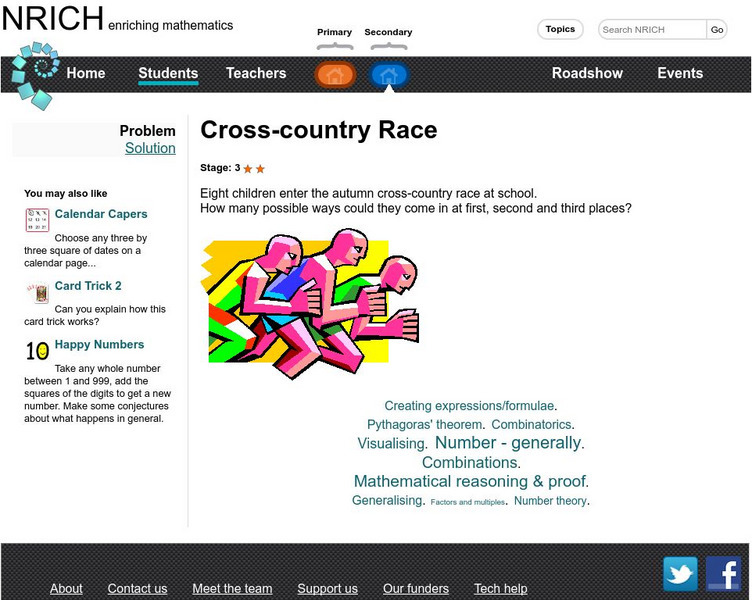
On this one page website sharpen your logic and problem solving skills while working on this challenge. The solution is available to double check your solution.


