Curated OER
Graphs that Represent Data Sets
These four scenarios all contain graphable data; can scholars match them to the correct bar graphs? All the data is in single-digit whole numbers. Some of the scenarios instruct kids to make a graph, while others don't. Clarify...
Curated OER
Estimate and Compare Data
Seventh graders explore the values that are used in order to describe data that is collected or given. They compare data using the statistical analysis provided by finding the mean, median, and range.
Curated OER
Graphs to Represent a Data Set
How many animals did Chaplin see at the zoo? Scholars examine three data sets and create a bar graph for each. Encourage them to label the different parts of their graphs, as this is not prompted on the worksheet. Once they finish their...
Curated OER
Graphs to Represent a Data Set
By analyzing a word problem about hours worked in a week, scholars get valuable practice with bar graphs and data analysis. They read the scenario, then examine a table of data taken from it. The data includes four days and the...
Curated OER
Quiz: Mean, Median, Mode, and Range
Use this measure of central tendency worksheet to have learners find mean, median, mode and range of ten sets of nine numbers. Numbers are presented in a series of lists.
Curated OER
Graphs to Represent a Data Set
As your scholars begin to learn how to read graphs, help them pay attention to detail with this matching activity. They read four short data descriptions and match them to one of the four bar graphs pictured. Each graph is labeled along...
Curated OER
Statistics
In this statistics worksheet, 9th graders solve and complete 10 various types of multiple choice problems. First, they determine the mean number of miles per day that were completed. Then, students determine the data set that has a...
Curated OER
Analyzing Data Sets
In this analyzing data sets activity, 11th graders solve and complete 35 various types of problems that include the analysis of data given. First, they determine the equation that best describes the data shown in a table. Then, students...
Curated OER
Central Tendency
In this central tendency learning exercise, 8th graders solve 10 different problems that include determining the mean, mode, and median of various situations. First, they prepare a frequency distribution with a class interval for the...
Curated OER
Graphs to Represent a Data Set
Here are the number of animals Jackson saw at the zoo; scholars organize data into bar graphs using this worksheet. Encourage labeling, but consider having scholars do these on another sheet because there isn't room for the x-axis to be...
Curated OER
Jumping to Conclusions
Students decide as a class what their data is going to be to graph. In this math lesson, students organize data so that it will be easier to display in a graph. Students are guided through the process by their teachers, and helped with...
Curated OER
Scatterplots
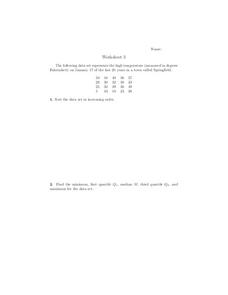
In this scatterplots learning exercise, 9th graders solve and complete 6 different word problems with different sets of data. First, they sort the data set in increasing order and find the minimum, first quartile, median, third quartile,...
Curated OER
Independent Practice 1: Box and Whisker Plot
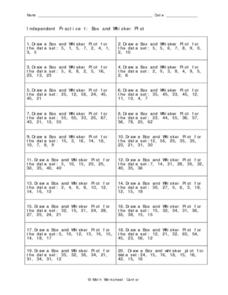
In this box and whisker plot activity, students create a box and whisker plot from a given set of data. They identify the lower quartile, upper quartile, the mean, and outliers. This one-page activity contains 20 sets of numbers from...
Google
Google for Education: Mean and Standard Deviation
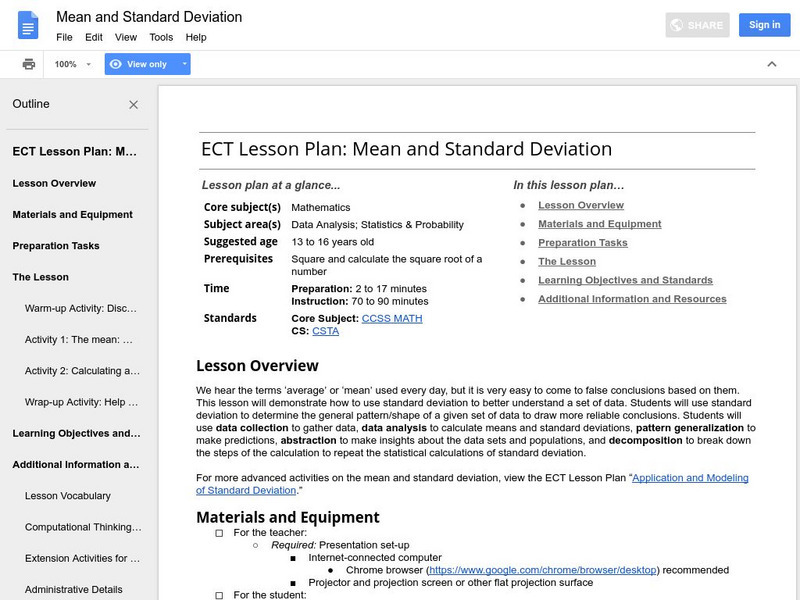
This lesson demonstrates to students how to use standard deviation to better understand a set of data. Students use standard deviation to determine the general pattern or shape of a given set of data to draw more reliable conclusions.
PBS
Pbs Learning Media: Chances Are
Focus on the "language" of probability by listing events from your life that are certain, impossible, likely and unlikely to happen. Determine the likelihood of an event occurring using a probability scale, based on a data set, and by...
CK-12 Foundation
Ck 12: Statistics: Variance of a Data Set
[Free Registration/Login may be required to access all resource tools.] Covers the variance for a normally distributed random variable.
Shodor Education Foundation
Shodor Interactivate: Lesson: Box Plots
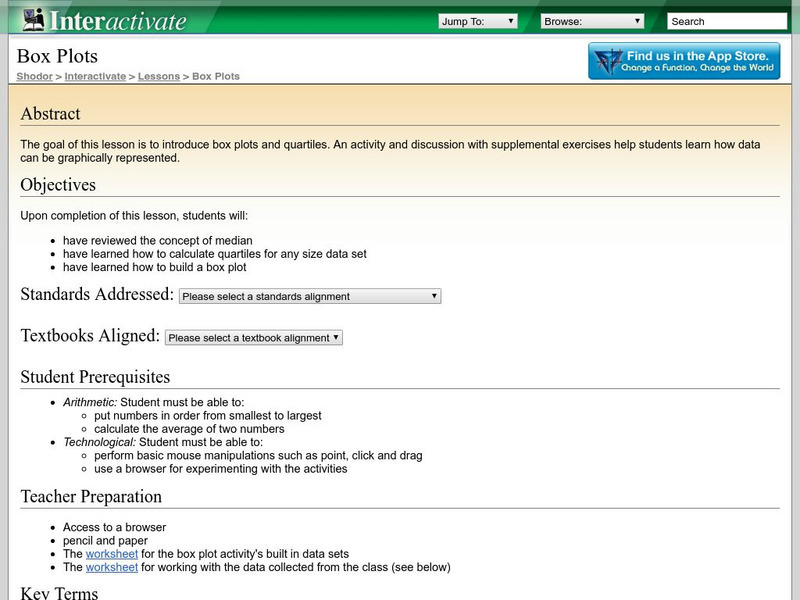
This lesson plan introduces quartiles and box plots. It contains an activity and discussion. Supplemental activities about how students can represent data graphically are also included.
Khan Academy
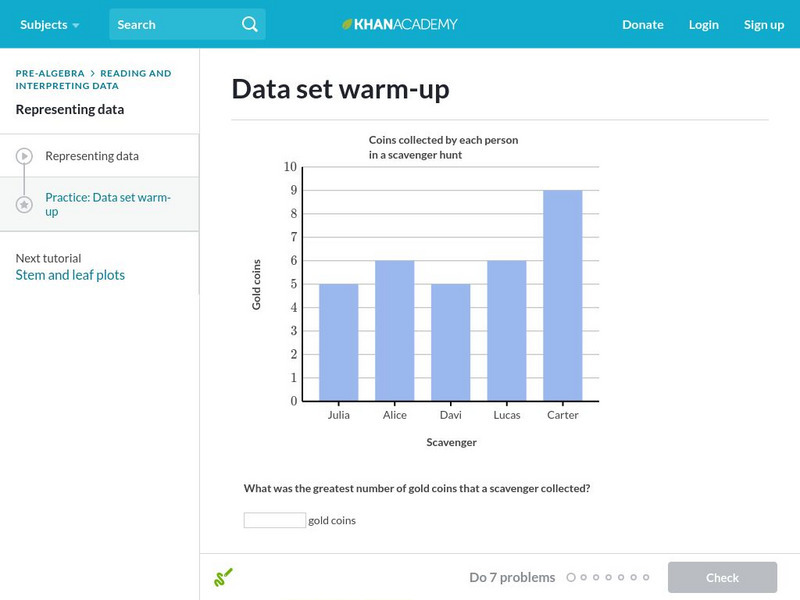
Khan Academy: Data Set Warm Up
Begin your journey into the world of statistics with some warm-up questions about data sets. Students receive immediate feedback and have the opportunity to try questions repeatedly, watch a video or receive hints.
Illustrative Mathematics
Illustrative Mathematics: Measuring Variability in a Data Set
The purpose of this student task is to develop understanding of standard deviation. Aligns with S-ID.A.2 and S-ID.A.3.
CK-12 Foundation
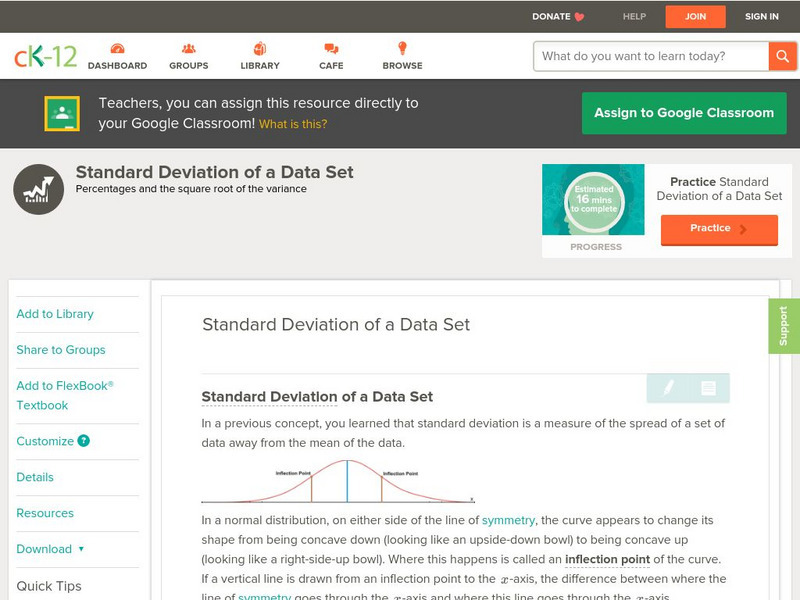
Ck 12: Statistics: Standard Deviation of a Data Set
[Free Registration/Login may be required to access all resource tools.] Learn about standard deviation of normally distributed data.
Quia
Ixl Learning: Mean, Median, Mode, and Range
Brush up on your math skills relating to mean, median, mode, and range then try some practice problems to test your understanding.
National Council of Teachers of Mathematics
Nctm: Comparing Properties of the Mean and Median
Through the use of technology, students can investigate how the mean and median of a set of date compares when values the data changes.
Shodor Education Foundation
Shodor Interactivate: Lesson: Stem and Leaf Plots
Lesson plan introduces young scholars to stem-and-leaf plots. Many resources are available for student and teachers here.
Books in the Classroom
Carol Hurst's Children's Literature Site: Data Gathering and Analyzing
Carol Hurst provides this sample chapter from "Picturing Math." Gathering data is a frequent part of solving problems and satisfying curiosity, which includes working with graphs and using mathematical tools such as averaging and other...


