Curated OER
Data Squares
Middle and high schoolers examine how data squares organize and sort information and data sets. They discuss examples of data squares, complete a data square about themselves, organize the data squares for the class together, and compile...
Curated OER
Measures of Central Tendency
Here is a measures of central tendency worksheet in which learners solve five multiple choice problems. They find the mean, median, and mode of a data set.
Curated OER
Mode in Statistics
Use this online math worksheet to have lerarners practice finding the mode in five different sets of data This excellent resource allows the students to check their answers, and to get "hints" should they run into difficulties. A...
Curated OER
Measuring Dispersion
Students compute the standard deviation for a given set of data. In this measuring dispersion lesson, students compute the mean, and then the distance from the mean for each data point. They find the standard deviation of the data.
Curated OER
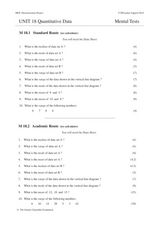
Unit 18 Quantitative Data
In this central tendency worksheet, students answer 30 short answer questions about data sets. Students find the median, mean, mode, and range of data sets.
Curated OER
Exploring Data Sets and Statistics in Baseball
Young scholars explore the concept data sets. In this data sets lesson, students find the 5 number summaries for salaries of teachers and compare them with 5 number summaries of professional baseball players. Young scholars use box and...
Curated OER
Reading Frequency Tables
In this data interpretation instructional activity, students record the data from 10 examples into frequency tables. They group 10 more data sets, and make a frequency table for each.
Curated OER
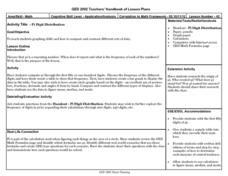
Pi Digit Distribution
Students study graphing skills and compare and contrast data sets. They compute pi through the first 50-100 digits and create a bar graph showing the frequencies of specific digits.


