BSCS Science Learning
Bscs: Frog Symphony
This inquiry focuses on analyzing spatial and temporal data for frog calls to determine the best time of day and location to hear a symphony of frogs. Click on the link for teaching guides and handouts.
BSCS Science Learning
Bscs: Frog Eat Frog World
Using maps and graphs of large data sets collected in FrogWatch, students will determine the range, preferred land cover, and proximity to water of the American bullfrog to figure out the bullfrog's requirements for food, water, and...
BSCS Science Learning
Bscs: Chesapeake Bay Algal Blooms
In this inquiry, students engage with mapping data to determine what kind of land coverage is contributing the most to harmful algal blooms in the Chesapeake Bay Watershed. Click on the link for teacher resources for teaching guides and...
Other
Bscs: Restoring Oyster Reefs
In this self-directed lesson plan, students use data from the Chesapeake Bay estuary to determine suitable sites for oyster reef restoration. A handout with everything the student needs to complete this lesson plan is available as a PDF...
Other
Bscs: Frog Symphony
For this self-directed lesson, students use maps and graphs of data to investigate the habitats and time of year and day to hear a full chorus of frogs. A handout with everything the student needs to complete this lesson is available as...
Other
Bscs: Frog Eat Frog World
In this self-directed lesson, students will use maps and Frogwatch data to explore the natural and invasive range of the American bullfrog. A handout with everything the student needs to complete this lesson is available as a PDF or...
Better Lesson
Better Lesson: Plotting Climate Data
Third graders use climate data to create a key, plot data points, and interpolate data.
The Wonder of Science
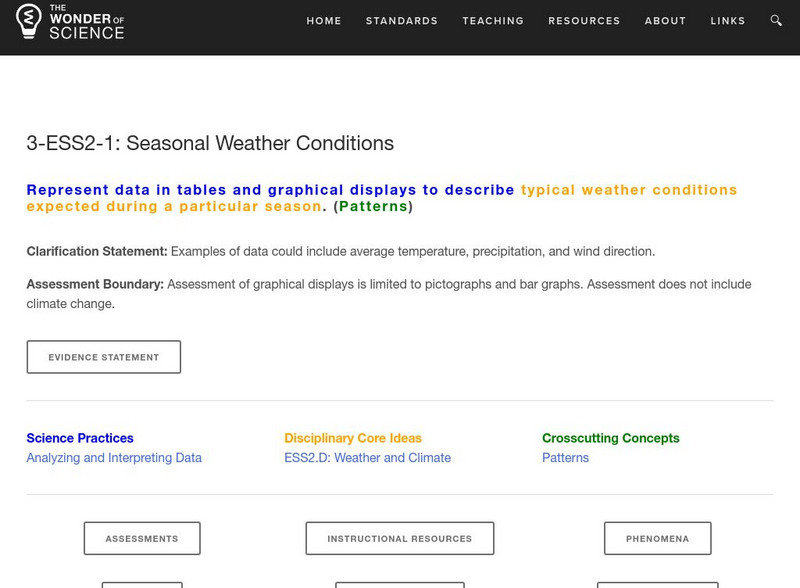
The Wonder of Science: 3 Ess2 1: Seasonal Weather Conditions
Work samples, phenomena, assessment templates, and videos that directly address standard 3-ESS2-1: seasonal weather conditions.


