Curated OER
Playing With Science
Young scientists investigate the scientific concepts and principles that help make common toys such as hula hoops, yo-yos, slinkies, and silly putty work. As a class, they read "Backyard Rocket Science, Served Wet" to get a look behind...
Curated OER
Multiplying in Any Order
In this mathematics worksheet, 2nd graders use counters to show an array. Then they write the multiplication fact for that array. Students also identify if the reverse of a multiplication fact is equal and explain why.
Curated OER
Identifying Parts of a Flower
Students identify, dissect, display and label parts of a flower. They dissect lilies and label each part as they tape it to a white sheet of paper.
Curated OER
PowerPoint Poems
Students identify how to play with poetry and create multi-media designs at the same time through PowerPoint. They select a poem of their own or a favorite published poem, and make it into a dancing, singing work of art as a PowerPoint...
Curated OER
What's The Teacher's Choice?
Fifth graders explore how to use data and display it using a chart or graph. They use food choices for categories and then gather the data and use the provided chart for display. In small groups students discuss the data and the results.
Cyberbee
Adventures of Cyberbee: Digital Audio Basics [Pdf]
Try this beginner's tutorial for recording sound on the computer. It covers the historical background of audio files, file formats, basic audio recording, synthesized music and copyright.
Other
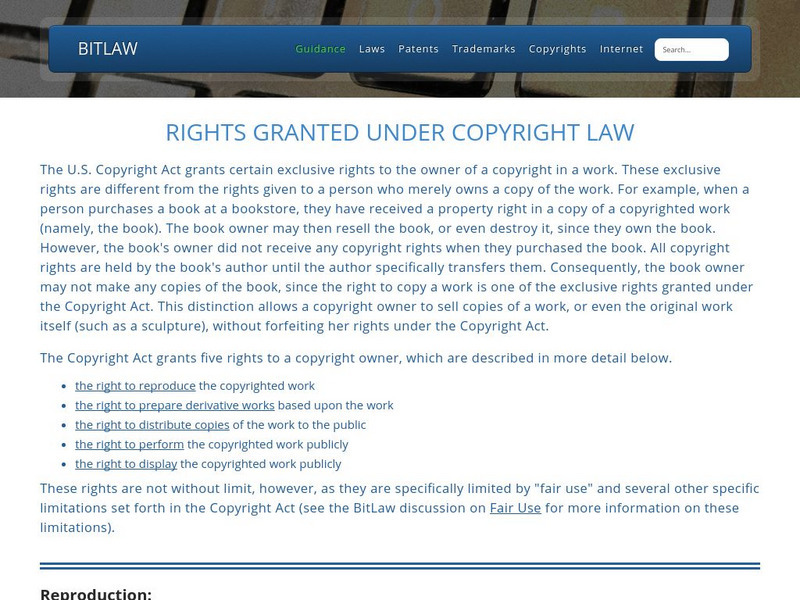
Bitlaw: Rights Granted Under Copyright Law
An article on the exclusive rights granted under the Copyright Act.
Discovery Education
Discovery Education: Hope Depot: Science Fair Central
Find advice on project ideas, project steps, presentation tips, classroom activities and more.
Better Lesson
Better Lesson: Graph Party
First graders will be involved in creating three different types of graphs and then be asked to answer questions about each representations data set.
Better Lesson
Better Lesson: What Is Your Favorite Pet?
SWBAT create a bar graph to match a data set. SWBAT analyze the graph to find 3 pieces of information the graph shows them.
Better Lesson
Better Lesson: What Is Your Favorite Little Bear Story?
SWBAT create a bar graph to match a data set. SWBAT analyze the graph for 3 pieces of information.
Better Lesson
Better Lesson: What Is Your Favorite Snack?
SWBAT use graphs to analyze whether a statement is true or false. SWBAT use graphs as evidence for a persuasive letter.
Better Lesson
Better Lesson: Heading Back
7, 8, 9, 10, 11, 12, Now Stop and Turn It Around! That is the idea today as the students are introduced to the idea of counting back to 1.
Louisiana Department of Education
Louisiana Doe: Louisiana Believes: Eureka Math Parent Guide: Collecting and Displaying Data
A guide to support parents as they work with their students in collecting and displaying data.
Other
Drs.cavanaugh: Science proj.handbook, Display Checklist
A checklist of the nine or ten items which should be on your display, plus an illustration of where they should go on a tri-fold poster.
Other
Meta Chart: Create Box and Whisker Chart
Design and share box and whisker chart with this web-based tool.


![Adventures of Cyberbee: Digital Audio Basics [Pdf] Article Adventures of Cyberbee: Digital Audio Basics [Pdf] Article](https://d15y2dacu3jp90.cloudfront.net/images/attachment_defaults/resource/large/FPO-knovation.png)


