Curated OER
To Recycle, or Not Recycle?
To recycle or not to recycle, that is the question. Your class can find the answer by taking a teacher created WebQuest, where they assume a role of a community member taking a stand on implementing a community wide recycling plan. The...
Curated OER
How to Draw a Bar Chart Correctly
Your class has gathered their data, so what's the next step? They need to display and analyze their data, and a bar chart is a perfect tool for the job. This resource provides the step-by-step instructions those kids need to construct a...
Curated OER
Frequency Tables - Home Link Support
For this home school support worksheet, 2nd graders, with a home support person, review the use of frequency tables to organize and display data. They make their own frequency table and read it with the support person.
Curated OER
Data Display
Students explore different ways to display data. In this statistics lesson plan, students create pie charts, bar graphs and line graphs to show data. Students then write a paragraph discussing which types of graphs are helpful for...
Curated OER
Graphing with Stems-and -Leafs
Fourth graders examine the use of stem and leaf graphs. For this stem and leaf graph lesson, 4th graders participate in teacher led lesson showing the use of the graphs. They work in groups to collect data about peanuts before making a...
Curated OER
Eat Your Veggies
Students investigate displaying data. In this displaying data lesson, students use tallies to count data about food preferences. Students use various types of graphs such as bar graphs, picture graphs, box-and-whisker plots, etc to...
Curated OER
Atlatl Lessons Grades 4-12: Lesson for Beginning Users of Atlatl
Sixth graders determine the mean, range median and mode of a set of numbers and display them. In this data activity students form a set of data and use computer spreadsheet to display the information. They extend of the process by...
Curated OER
Graph Those Stickers!
Students graph fruit. In this graphing lesson students create a graph using fruit label stickers. Students place a sticker on the graph when the fruit has been consumed.
Curated OER
Making a Bar Graph
In this bar graph worksheet, students analyze a data table and bar graph depicting information about stickers collected. Students answer 5 questions about the data displayed.
Shodor Education Foundation
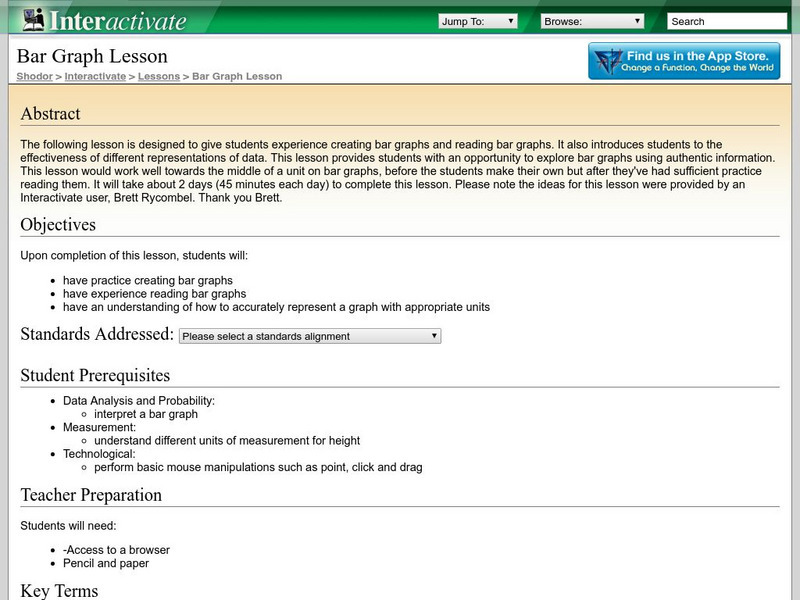
Shodor Interactivate: Lesson: Bar Graph
This lesson is designed to give students practice creating and reading bar graphs as well as understanding how to accurately represent a graph with appropriate units.
University of Texas
Inside Mathematics: Our Pets [Pdf]
This task challenges a student to demonstrate understanding of concepts involved in representing and interpreting data.
University of Texas
Inside Mathematics: Parking Cars [Pdf]
This task challenges a student to use their understanding of scale to read and interpret data in a bar graph.
Texas Education Agency
Texas Gateway: Graphing Data to Demonstrate Relationships
Given problem situations, the student will graph data with a constant rate of change to demonstrate relationships in familiar concepts, such as scaling.
Center for Innovation in Engineering and Science Education, Stevens Institute of Technology
Ciese Real Time Data Projects: Weather Scope: A Study of Weather and Climate
Use real-time data to study factors that affect weather and climate, create weather instruments, and share data with students around the world.
McGraw Hill
Glencoe: Self Check Quizzes 1 Analyzing Graphs
Use Glencoe's randomly generated self-checking quiz to test your knowledge of how to analyze graphs. Each question has a "Hint" link to help. Choose the correct answer for each problem. At the bottom of the page click the "Check It"...
National Council of Teachers of Mathematics
Nctm: Illuminations: State Data Map
Data can be displayed in a variety of ways. This interactive map of the United States shows data by degrees of color. Choose to display data such as: land area, population, population density, gas use, and much more.
Government of Alberta
Learn Alberta: Math Interactives: Exploring Data Display and Graphs
This multimedia Learn Alberta math resource focuses on graphing data. In the video portion, students will see how math is involved in the display of merchandise in stores. The accompanying interactive component provides an exploration...
Better Lesson
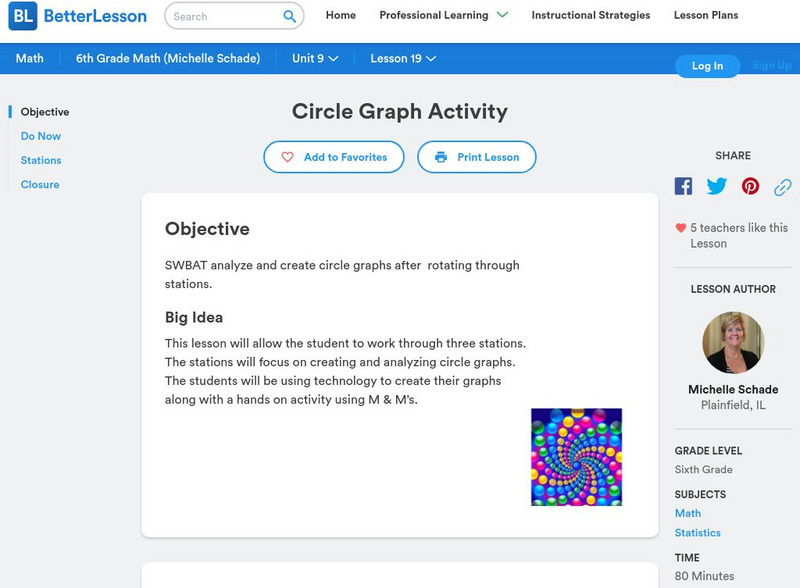
Better Lesson: Circle Graph Activity
This lesson will allow the student to work through three stations. The stations will focus on creating and analyzing circle graphs. The students will be using technology to create their graphs along with a hands-on activity using M&M's.
Cuemath
Cuemath: Line Graphs
A comprehensive guide for learning all about line graphs with definitions, their sections, how to read and create graphs, solved examples, and practice questions.
Cuemath
Cuemath: Dot Plot
A comprehensive guide for learning all about dot plots with definitions, how to construct them, solved examples, and practice questions.
Cuemath
Cuemath: Bar Graphs
A comprehensive guide for learning all about bar graphs with definitions, solved examples, and practice questions.
Cuemath
Cuemath: Linear Graph
A comprehensive guide for learning all about linear graphs with definitions, properties, their equations, how to plot or analyze them, solved examples, and practice questions.
Cuemath
Cuemath: Pie Charts
A comprehensive guide for learning all about pie charts with definitions, solved examples, and practice questions.
Cuemath
Cuemath: Histograms
A comprehensive guide for learning all about histograms with definitions, solved examples, and practice questions.


![Inside Mathematics: Our Pets [Pdf] Lesson Plan Inside Mathematics: Our Pets [Pdf] Lesson Plan](https://d15y2dacu3jp90.cloudfront.net/images/attachment_defaults/resource/large/FPO-knovation.png)


