Curated OER
Excel Turns Data Into Information
Students use excel to analyze data. In this technology lesson, students enter data into the excel program to find averages and organize data.
Curated OER
How to keep a timecard in Excel
Students fill out a timecard of family activities in Microsoft Excel. In this Excel lesson plan, students use the program to fill in times they do various activities with their families.
Alabama Learning Exchange
The State Capital of Stem and Leaf
Students explore the concept of stem and leaf plots. In this stem and leaf plots lesson, students plot the 50 US states' capitals on a stem and leaf plot according to the first letter of each state. Students compare...
Curated OER
Graphing
Students gather statistical information on a chosen topic and place it into a spreadsheet. Using th Excel chart wizard, students create tables, graphs and charts of their information. They interpret the data and share it with the class.
Curated OER
Introductory Excel Lesson involving Problem Solving
Sixth graders analyze an introductory lesson plan for Microsoft Excel. They go step by step through the creation of a basic spreadsheet and the use of simple formulas in a problem solving format.
Education World
A Spooky Adlib Story
Young scholars navigate a simple spreadsheet and develop their creativity. They answer questions, filling in cells on Excel, using a template after filling in all the fields, a silly spooky story is created from the answers they give....
Curated OER
Made Round To Go Round
In this lesson learners investigate what it would cost to furnish one room of their choice by shopping on the Internet. Both Australian and American dollars are to be given for each item to demonstrate the difference between two...
Curated OER
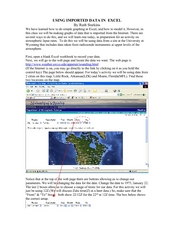
Using Imported Data in Excel
Students import atmospheric data from the internet. In this earth science activity, students graph the data they collected. They complete the worksheet after the activity.
Curated OER
Ict Activity 22
Students use Excel to solve quadratic equations by trial and improvement. They enter formulas and try different solutions to improve their solutions more quickly. Afterwards, they report the solutions to different levels of accuracy.
Curated OER
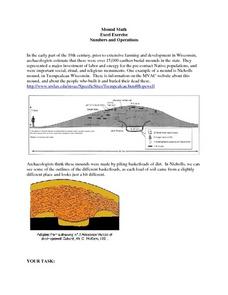
Mound Math
Learners examine the many different burial mounds in Wisconsin. In groups, they use the internet to discover how long it took to build a specific mound. They must calculate the measurements of the mound to make a scale model.
Curated OER
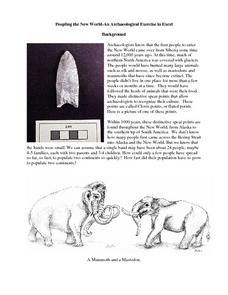
Peopling the New World -- An Archaeological Exercise in Excel
Middle schoolers examine different types of spears that have been discovered from various civilizations. In groups, they calculate the answers to various word problems and enter their information on a spreadsheet. They use the data in...
Curated OER
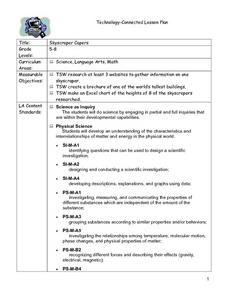
Skyscraper Capers
Students discuss skyscrapers and listen as the teacher introduces the project. They use the Internet to perform research on one skyscraper. Students use information they gather to create a brochure of their building . They create an...
Curated OER
Careers
Eighth graders research careers on the computer to determine which career they are interested in. They create a spreadsheet using the Excel program and calculate the budget for their desired lifestyle and determine if this income is...
Curated OER
Pet Count Excel Graphing
Young scholars used collected data to distinguish what pets they have or would like to have. They correlate findings with appropriate technology--Excel. At the end of the lesson they tabulate a bar chart and present their findings to the...
Curated OER
Using Averages to Create Graphs Through Excel
Sixth graders create and use a spreadsheet to make graphs which will be used to analyze Progress Report and Final Report Card grades. They practice finding the mean, median, mode, and range of a data set. Students also incorporate column...
Curated OER
Food for Thought
Third graders conduct a survey of their class' favorite foods voting on 3-4 favorites overall. They then go to the computer lab and examine how to produce a horizontal bar graph by graphing the favorite foods of the class.
Curated OER
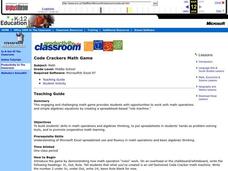
Code Crackers
Middle schoolers work in teams creating and posing math rules and trying to guess them using a formula controlled worksheet they create with Excel. Student pairs take turns to see who can crack the other's code the fastest.
Curated OER
Virtual Field Trip
Learners calculate gasoline cost per mile on a virtual field trip. They calculate the gasoline costs and travel time for each of the 2 routes, and record on a data sheet. They use Excel to create data tables for mileage, gasoline...
Curated OER
Graphing
Fifth graders create graphs based on climate in South Carolina. They read and interpret information in a chart and construct a graphy from the information in the chart. They create a spreadsheet using Excel and publish 2 graphs.
Curated OER
You mean college costs that much?
Seventh graders collect, organize, and analyze data as they research colleges on the Internet. They graph their collected data on a line graph and use a spreadsheet on Microsoft Excel in order to organize the data.
Curated OER
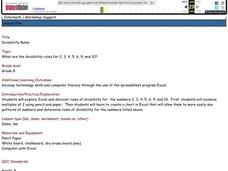
Divisibility Rules
Eighth graders explore Excel and discover rules of divisibility for the numbers 2, 3, 4, 5, 6, 9, and 10; students examine multiples of 2 using pencil/ paper, then create a chart in Excel that will allow them to more easily see patterns...
Science Education Resource Center at Carleton College
Serc: Exploring Regional Differences in Climate Change
Students create a set of graphs that facilitate comparison of climate change predicted for various states. They also use Microsoft Excel to create a graph showing precipitation data.
TeachEngineering
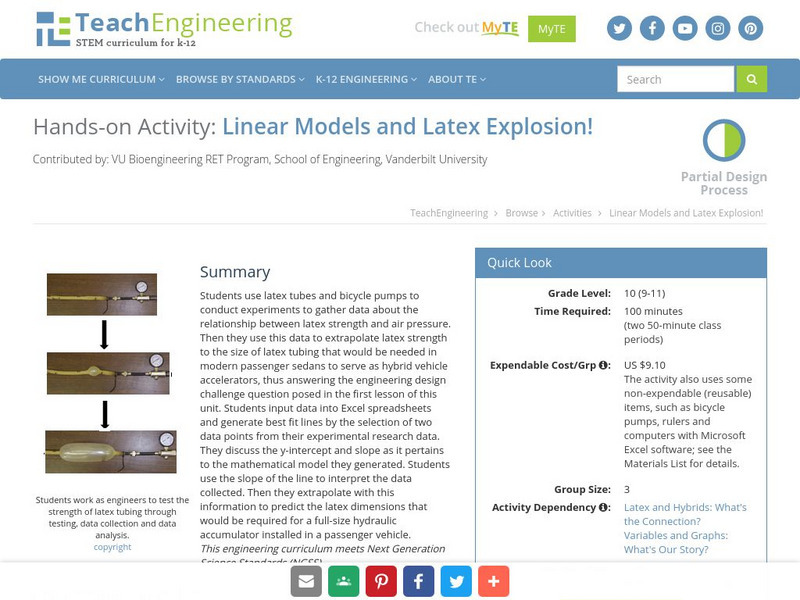
Teach Engineering: Linear Models and Latex Explosion!
Students use latex tubes and bicycle pumps to conduct experiments to gather data about the relationship between latex strength and air pressure.
TeachEngineering
Teach Engineering: Latex Tubing and Hybrid Vehicles
This unit gives students the opportunity to make use of linear models in order to make predictions based on real-world data. Students experience how engineers address incredible and important design challenges through the use of linear...


