Curated OER
Courtship and Marriage
Students research the concept of courtship and marriage as it pertains to early New England and explore the values and culture that shaped our history. In this courtship and marriage lesson, students examine primary source documents that...
Annenberg Foundation
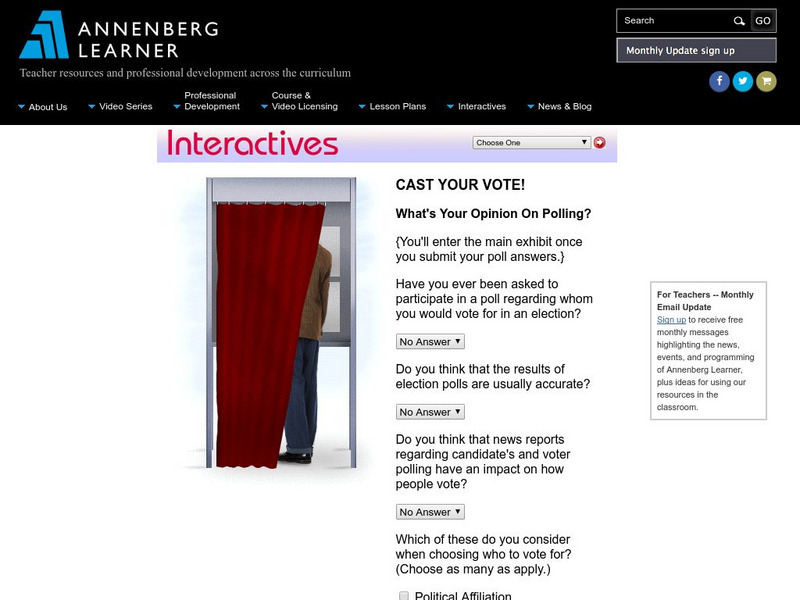
Annenberg Learner: Interactives: Cast Your Vote!
Upper elementary, middle, and high school students can use this exhibit to get an understanding of how polls and elections are conducted. The discussion includes random samples, margins of error, and other concepts related to statistics.
Center for Innovation in Engineering and Science Education, Stevens Institute of Technology
Ciese Real Time Data Projects: Weather Scope: A Study of Weather and Climate
Use real-time data to study factors that affect weather and climate, create weather instruments, and share data with learners around the world.
Other
A River Runs Through It Learning Project
In this year long learning project integrating mathematics and science, students solve environmental problems using data collection and problem solving concepts. Designed for upper elementary gifted students. Interactive components and...
Education Development Center
Math Partners: Statistics and Probability [Pdf]
Comprehensive unit that consists of lessons and activities designed to help students learn statistics and probability concepts.
Texas Education Agency
Texas Gateway: Evaluating Data in Tables, Graphs and Charts
[Accessible by TX Educators. Free Registration/Login Required] In this lesson students look at examples of graphics, tables, charts, and graphs, and learn how to interpret their data. They will be able to use this skill to enhance their...
Other
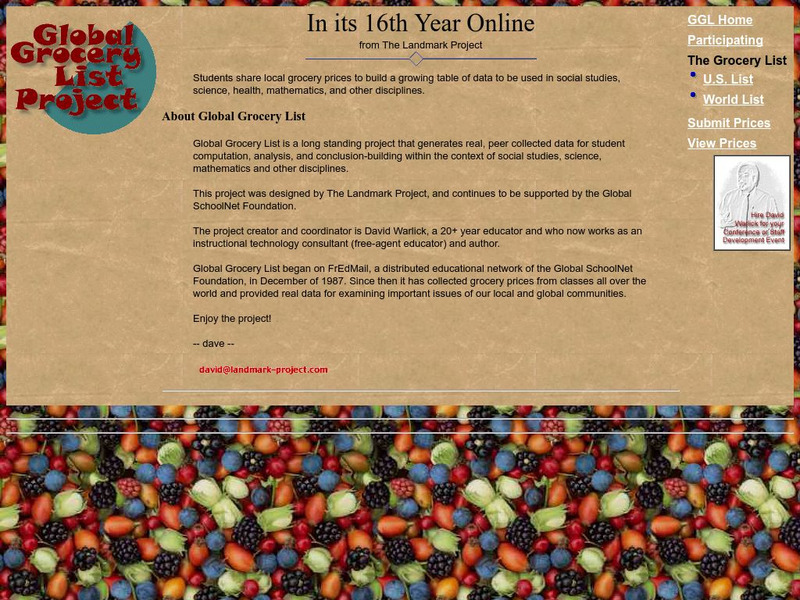
Global Grocery List Project: Homepage
At this site from the Global Grocery List Project, students collect data on the prices of common grocery items and submit their findings. They can then compare the data they collected to data from students around the world. There are...
National Council of Teachers of Mathematics
Nctm: Figure This: Do Women Live Longer Than Men?
Use this site to figure out if women really do live longer than men. A math challenge taken from today's health journals that explores data collection, data analysis, patterns, and graphing skills. Learn how mastering these skills can be...
National Council of Teachers of Mathematics
Nctm: Figure This: Tv Ratings (Pdf)
Here's a challenge for the avid TV watcher. Use your data interpretation skills to explore America's TV watching habits in this NCTM Math Challenges for Families activity. See if you can figure out which night of the week has the...
Houghton Mifflin Harcourt
Holt, Rinehart and Winston: Homework Help Independent Practice: Interpreting Graphs and Tables
Get independent practice interpreting graphs and tables. Each incorrect response gets a text box explanation and another try. Correct responses are confirmed.
National Council of Teachers of Mathematics
Nctm: Figure This: How Many Fish in the Pond?
Can you figure out how many fish are in a pond? Use the statistical method of capture-recapture and estimation to solve this math challenge. An investigation from the NCTM Math Challenges for Families series. Discover how this skill can...
Rice University
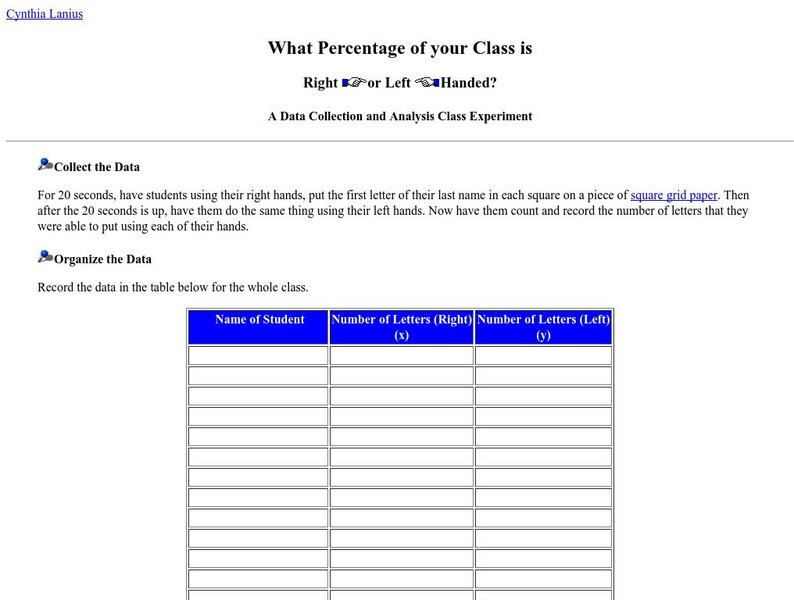
What Percentage of Your Class Is Right or Left Handed?
What percentage of the class is right or left-handed? Students will investigate this question using statistical processes of collecting the data, organizing it, graphing, and finally analyzing it. Follow-up questions are provided for the...
Rice University
Rice University: The Hand Squeeze
Students will enjoy this data collection and class analysis experiment involving the time it takes for a hand squeeze to travel around a circle of people. From organizing the activity to collecting the data to making a table and graphing...



![Math Partners: Statistics and Probability [Pdf] Unit Plan Math Partners: Statistics and Probability [Pdf] Unit Plan](https://d15y2dacu3jp90.cloudfront.net/images/attachment_defaults/resource/large/FPO-knovation.png)

