Curated OER
Human Number Line
Fourth graders become aware and comprehend number relationships among those numbers most commonly found in geometric applications. They work in groups, 4th graders arrange themselves in order form the least to the greatest number in...
Curated OER
How Alike Are We?
Fourth graders find the range, mode, median, and mean for each of the data sets (height and shoe size). They discuss which measure of central tendency for each data set best represents the class and why. Students graph the shoe size and...
Curated OER
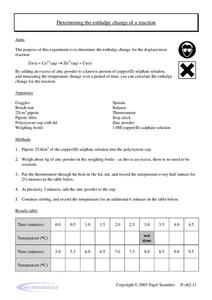
Determining the Enthalpy Change of a Reaction
In this enthalpy of reactions instructional activity, students use a known amount of copper (II) sulphate solution and an excess of zinc powder to calculate the enthalpy change of the reaction. Students measure the temperature change...
Curated OER
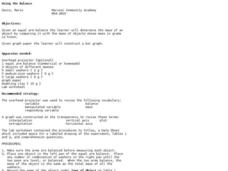
Using the Balance
Young scholars determine the mass of various objects. In this integrated math and science lesson, students use an arm balance to compare a known object to a combination of washers with a fixed weight. Young scholars record data,...
Texas Instruments
Math TODAY for TI-Navigator System - Is Leisure Time Really Shrinking?
High schoolers organize data from the USA TODAY Snapshot, "Is leisure time really shrinking?" into two scatter plots and determine the quadratic model for each scatter plot. They determine if these graphs intersect and learn the concept...
Curated OER
Extraordinary Extrapolation
Students study how scientists have estimated the maximum height to which trees can grow, and assess the reliability of interpolation and extrapolation techniques by making predictions with particular data sets and analyzing accuracy of...
Curated OER
Point Graphs
Students experiment with point graphs. In this math instructional activity, students are divided into groups and perform an experiment to see how high a ball bounces, recording their results on a point graph. Students then answer...
Curated OER
Numerical Analysis: Polynomial Interpolation
In this polynomial instructional activity, students identify the interpolated and extrapolated value of given equations. This four-page instructional activity contains approximately ten problems. Explanations and examples are provided.
Curated OER
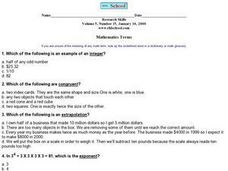
Math Terms- Congruent, Integer, Extrapolation, Exponent
For this math terms worksheet, students answer 4 multiple choice questions about the meaning of congruent, extrapolation, exponents, and integers.
Georgia Department of Education
Ga Virtual Learning: Media Literacy
Activities in this comprehensive interactive tutorial will involve determining the strengths and limitations of epidemiological reports. You will also evaluate media messages and develop your own.
TeachEngineering
Teach Engineering: How High Can a Super Ball Bounce?
Students determine the coefficient of restitution (or the elasticity) for super balls. Working in pairs, they drop balls from a meter height and determine how high they bounce. They measure, record and repeat the process to gather data...
Texas Instruments
Texas Instruments: Math Today for Ti: Is Leisure Time Really Shrinking
Students will to organize data from the USA TODAY Snapshot, "Is leisure time really shrinking?," into two scatter plots and determine the quadratic model for each scatter plot. Students will determine if these graphs intersect and learn...
Other
Stat Soft: Statistics Glossary
Dozens of statistical terms are defined and illustrated in this glossary.
CK-12 Foundation
Ck 12: Algebra: Linear Interpolation and Extrapolation
[Free Registration/Login may be required to access all resource tools.] Learn how to use linear interpolation and extrapolation to make predictions.
CK-12 Foundation
Ck 12: Analysis: Exponential Models
[Free Registration/Login may be required to access all resource tools.] In this lesson students will be identifying, applying, and solving exponential models manually and with technology. Students examine guided notes, review guided...
Texas Instruments
Texas Instruments: Boat Registration and Manatee Deaths in Florida
Students will explore the data on boat registrations and manatee deaths in Florida. They will use the data, the graph of the data and the line of best fit to make predictions about the relationship of the data.
Other
Introduction to Simple Linear Regression
This introduction to simple linear regression includes graphs and a discussion of extrapolation and interpolation.


