CK-12 Foundation
Ck 12: Statistics: Double Line Graphs
[Free Registration/Login may be required to access all resource tools.] Construct and interpret double line graphs.
CK-12 Foundation
Ck 12: Statistics: Effects on Box and Whisker Plots
[Free Registration/Login may be required to access all resource tools.] This Concept covers the effects of outliers and a change in units on box-and-whisker plots.
CK-12 Foundation
Ck 12: Statistics: F Distribution
[Free Registration/Login may be required to access all resource tools.] In this Concept, students will be introduced to the F-distribution in order to test hypotheses about multiple independent population variances.
CK-12 Foundation
Ck 12: Statistics: Frequency Polygons
[Free Registration/Login may be required to access all resource tools.] Construct frequency polygons.
CK-12 Foundation
Ck 12: Frequency Tables to Organize and Display Data Grades 6 7
[Free Registration/Login may be required to access all resource tools.] Create a frequency table from given data.
CK-12 Foundation
Ck 12: Frequency Tables to Organize and Display Data Grade 7
[Free Registration/Login may be required to access all resource tools.] Make a frequency table to organize and display data.
CK-12 Foundation
Ck 12: Statistics: Grouped Data to Find the Mean
[Free Registration/Login may be required to access all resource tools.] Covers frequency distribution tables with grouped data.
CK-12 Foundation
Ck 12: Statistics: Histograms Grades 11 12
[Free Registration/Login may be required to access all resource tools.] This Concept covers making frequency tables and using them to create a histogram.
CK-12 Foundation
Ck 12: Statistics: Histograms Grade 7
[Free Registration/Login may be required to access all resource tools.] Make a histogram given a frequency table.
CK-12 Foundation
Ck 12: Statistics: Inferences About Regression
[Free Registration/Login may be required to access all resource tools.] This Concept introduces students to testing a claim about linear regression.
CK-12 Foundation
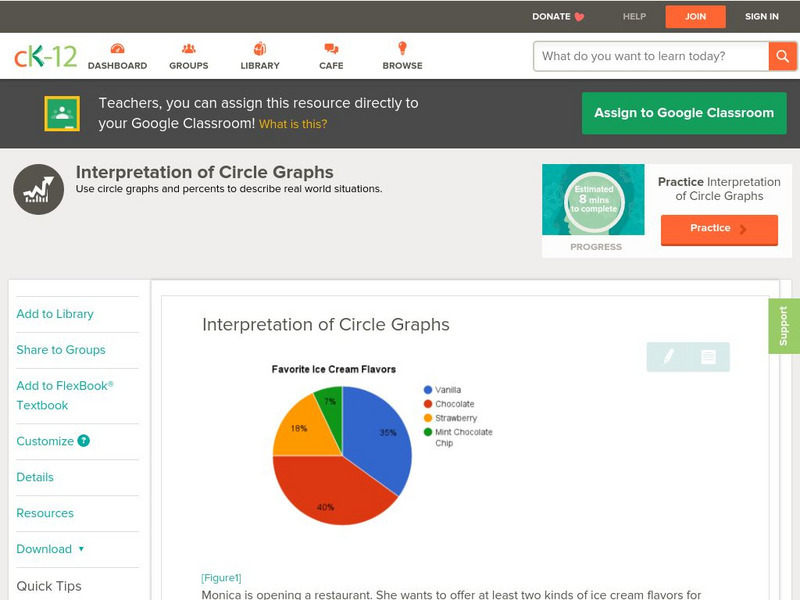
Ck 12: Statistics: Interpretation of Circle Graphs Grades 6 7
[Free Registration/Login may be required to access all resource tools.] Read and interpret circle graphs.
CK-12 Foundation
Ck 12: Statistics: Interpretation of Circle Graphs Grade 7
[Free Registration/Login may be required to access all resource tools.] Interpret circle graphs by using given data.
CK-12 Foundation
Ck 12: Introduction to Data and Measurement Issues Grades 11 12
[Free Registration/Login may be required to access all resource tools.] This Concept familiarizes students with data analysis and statistical terminology.
CK-12 Foundation
Ck 12: Statistics: Kruskal Wallis Test and Runs Test
[Free Registration/Login may be required to access all resource tools.] This Concept introduces the Kruskal Wallis test, as well as demonstrates ho to determine the randomness of a sample using the runs test.
CK-12 Foundation
Ck 12: Statistics: Levels of Measurement
[Free Registration/Login may be required to access all resource tools.] This Concept introduces students to the different levels of measurement.
CK-12 Foundation
Ck 12: Statistics: Line Graphs Grades 9 10
[Free Registration/Login may be required to access all resource tools.] Make a line graph to display data over time.
CK-12 Foundation
Ck 12: Statistics: Line Graphs Grade 7
[Free Registration/Login may be required to access all resource tools.] Make a line graph to display data over time.
CK-12 Foundation
Ck 12: Statistics: Line Graphs to Display Data Over Time
[Free Registration/Login may be required to access all resource tools.] Create line graphs to display how data changes over time.
CK-12 Foundation
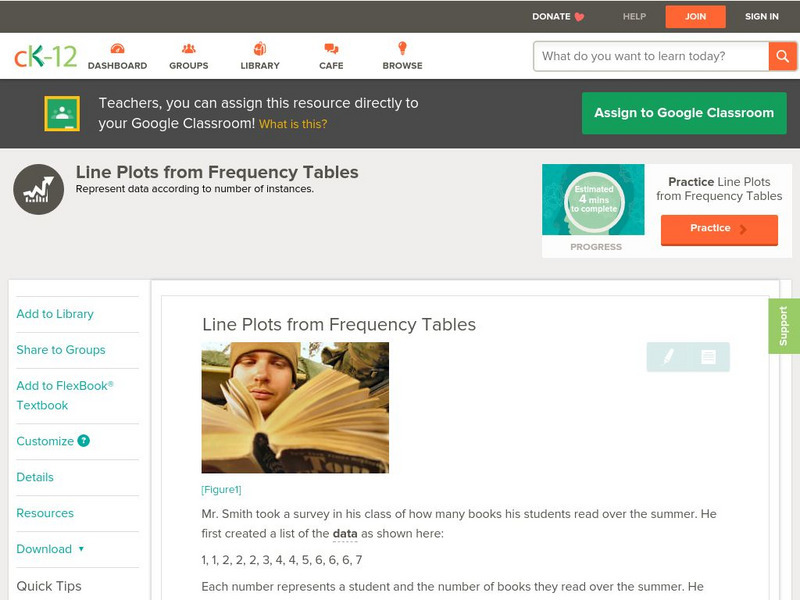
Ck 12: Statistics: Line Plots From Frequency Tables
[Free Registration/Login may be required to access all resource tools.] Create a line plot given data organized in a frequency table.
CK-12 Foundation
Ck 12: Statistics: Mean Grade 6
[Free Registration/Login may be required to access all resource tools.] Determine the mean, or average, in a given set of data.
CK-12 Foundation
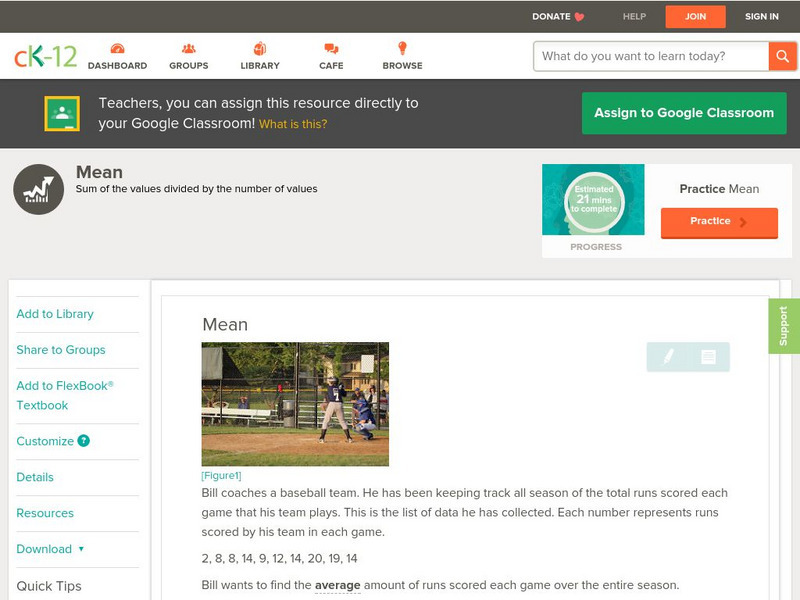
Ck 12: Statistics: Mean
[Free Registration/Login may be required to access all resource tools.] Find the mean of a set of data.
CK-12 Foundation
Ck 12: Statistics: Median Grade 6
[Free Registration/Login may be required to access all resource tools.] Determine the median in a given set of data.
CK-12 Foundation
Ck 12: Statistics: Median Grade 7
[Free Registration/Login may be required to access all resource tools.] Find the median of a set of data.
CK-12 Foundation
Ck 12: Statistics: Median of Large Sets of Data
[Free Registration/Login may be required to access all resource tools.] Find the median of large sets of data.


