Houghton Mifflin Harcourt
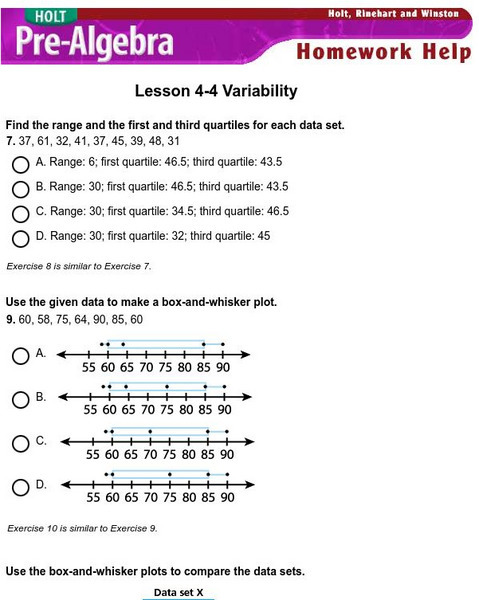
Holt, Rinehart and Winston: Homework Help Independent Practice: Variability
Get independent practice working with variability. Each incorrect response gets a text box explanation and another try. Correct responses are confirmed.
Texas Instruments
Texas Instruments: Create Box and Whisker Plots
Students use a graphing calculator to create box-and-whisker plots and learn the usefulness of them. Students identify the five summary statistical values of data sets - minimum, first quartile, median, third quartile, and maximum values.
Other
Nmu: Box and Whisker Plot Instructions
Site discusses the use of box-and-whisker plots. An example is presented and completely worked through, so that the user can see the results of the calculations after the steps have been explained.


