Curated OER
Statistical Calculations Using M&Ms
In this frequency worksheet, students investigate, frequency, box plots, and percentage using a package of M&Ms. Copies of the actual correspondences with the Mars company are also included.
PBS
Pbs Learning Media: Restocking Shoes
In this video from Cyberchase, Bianca uses data on past shoe sales to help her decide what quantities of each size she should order in the next shipment.
Missouri State University
Missouri State University: Introductory Statistics: Frequency Distributions
Provides a complete discussion of frequency distributions. Site is presented in notes with examples added as needed.
Missouri State University
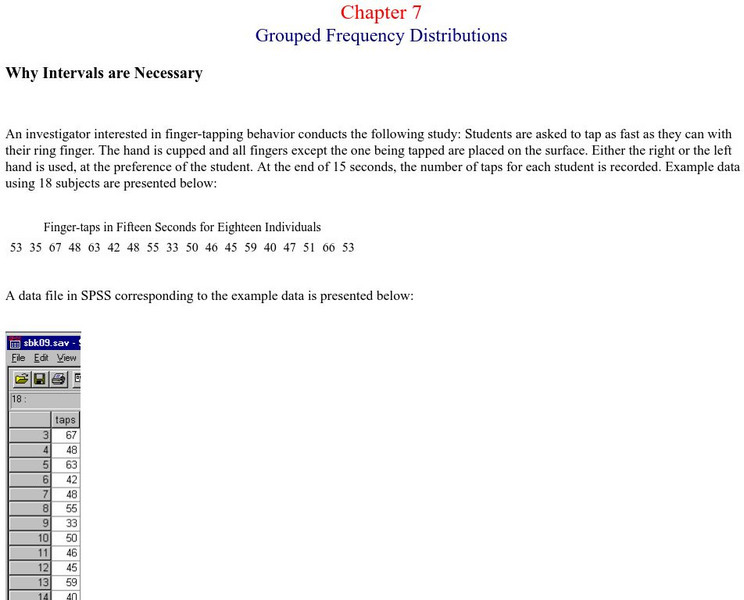
Missouri State Univ.: Introductory Statistics: Grouped Frequency Distributions
An example is provided for the explanation of grouped frequency distributions. Graphs show how to construct histograms and overlapping bell curves, and Excel documents are discussed as being useful here.
McGraw Hill
Glencoe: Self Check Quizzes 1 Frequency Tables
Use Glencoe's randomly generated self-checking quiz to test your knowledge of frequency tables. Each question has a "Hint" link to help. Choose the correct answer for each problem. At the bottom of the page click the "Check It" button...
Wolfram Research
Wolfram Math World: Frequency Distribution
This site from MathWorld provides a general overview of frequency distribution, complete with a bar graph and explanatory text.
Texas Instruments
Texas Instruments: Frequency Data
Student activity for developing vocabulary with respect to frequency of data represented in various forms.
Palomar Community College District
Palomar College: Relative Frequency Polygon
A step-by-step worked problem from the Palomar College demonstrating how to take a set of data and produce a relative frequency polygon. Hints are provided along the way, and the final graph is shown for the user to check.
Palomar Community College District
Palomar Community College: Behavioral Science Statistics: Class Intervals
A sample problem on creating intervals for a frequency distribution. The example is worked out and explained along the way.
Other
Clayton State: Organizing & Presenting a Frequency Dist.
The easiest method of organizing data is a frequency distribution, which converts raw data into a meaningful pattern for statistical analysis. Learn how in this tutorial with examples.
Palomar Community College District
Behavioral Science Stats: Grouped Frequency Distribution
A sample problem that utilizes frequency distributions to find the frequency, relative frequency, intervals and cumulative relative frequencies for the given problem. The example is worked through step-by-step with a great explanation...
University of Texas at Austin
Mathematics Teks Toolkit: The Sounds of Music
In this lesson plan, students collect data, graph it, then determine the period and frequency of the sound waves made by a guitar.
McGraw Hill
Glencoe Mathematics: Online Study Tool: Quiz on Frequency Distributions
Learners demonstrate comprehension of advanced mathematical concepts. The online quiz tests the students on frequency distributions.
Palomar Community College District
Palomar College: Frequency Polygon an Example
A step-by-step worked problem demonstrating how to take a set of data and produce a frequency polygon. Hints are provided along the way and the final graph is shown for the user to check.
Science Education Resource Center at Carleton College
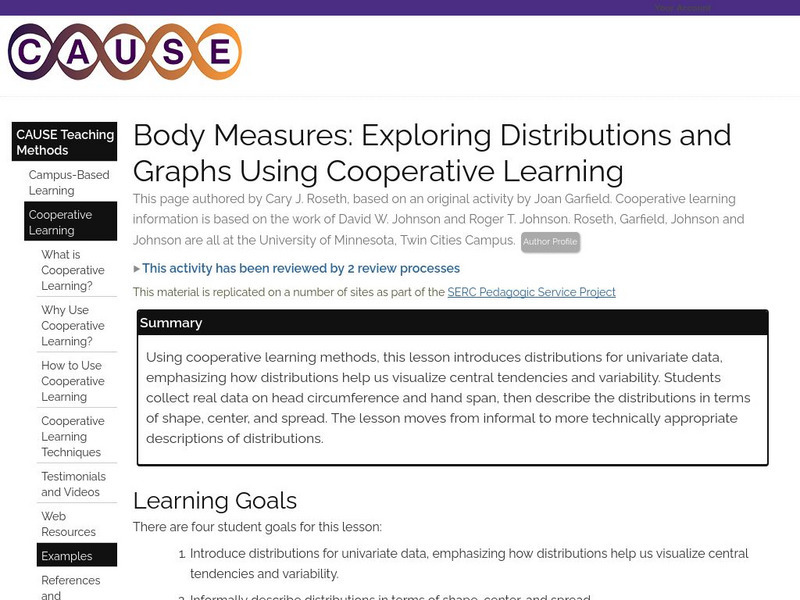
Serc: Exploring Distributions and Graphs Using Cooperative Learning
Using cooperative learning methods, this lesson plan introduces distributions for univariate data, emphasizing how distributions help us visualize central tendencies and variability. Students collect real data on head circumference and...
Mangahigh
Mangahigh: Data: Find the Class Interval Containing the Mode
Students watch an online tutorial on the concept of finding mode from a frequency table. After watching, students test their knowledge by attempting ten practice problems that increase or decrease in difficulty based on their answers.
Mangahigh
Mangahigh: Data: Use Frequency Tables
This site provides students practice with the concept of frequency tables. Students can learn about the topic by completing an interactive tutorial. Students can then take a ten question timed test to practice the skill.
Mangahigh
Mangahigh: Data: Trend Graphs
Students explore the concept of frequency trend graphs by working through an online tutorial and then attempting a ten question quiz that increases in difficulty as questions are answered correctly.
CK-12 Foundation
Ck 12: Statistics: Frequency Polygons
[Free Registration/Login may be required to access all resource tools.] Construct frequency polygons.
CK-12 Foundation
Ck 12: Statistics: Histograms Grades 11 12
[Free Registration/Login may be required to access all resource tools.] This Concept covers making frequency tables and using them to create a histogram.
CK-12 Foundation
Ck 12: Statistics: Histograms Grade 7
[Free Registration/Login may be required to access all resource tools.] Make a histogram given a frequency table.
Khan Academy
Khan Academy: Comparing Distributions
Practice comparing distributions that are presented in dot plots, histograms, and box plots. Students receive immediate feedback and have the opportunity to try questions repeatedly, watch a video or receive hints.
Khan Academy
Khan Academy: Creating Frequency Tables
In this exercise, students practice creating frequency tables. Students receive immediate feedback and have the opportunity to get hints and try questions repeatedly.
Khan Academy
Khan Academy: Interpreting Two Way Tables
Do you understand how two-way tables really work? Here's your chance to practice. Students receive immediate feedback and have the opportunity to try questions repeatedly, watch a video, or receive hints.


