Khan Academy
Khan Academy: Two Way Frequency Tables
Given a Venn diagram or information about a relationship, create a two-way frequency table. Students receive immediate feedback and have the opportunity to try questions repeatedly, watch a video, or receive hints.
Khan Academy
Khan Academy: Two Way Relative Frequency Tables
Practice creating two-way relative frequency tables from a two-way frequency table. Students receive immediate feedback and have the opportunity to try questions repeatedly, watch a video, or receive hints.
Math Is Fun
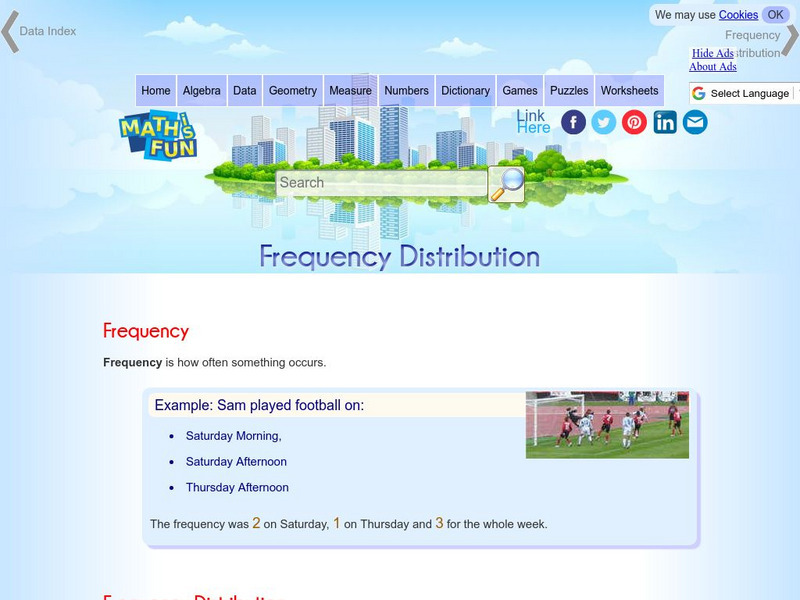
Math Is Fun: Frequency Distribution
Explains, with examples, what a frequency distribution table is. Includes a set of practice questions.
Khan Academy
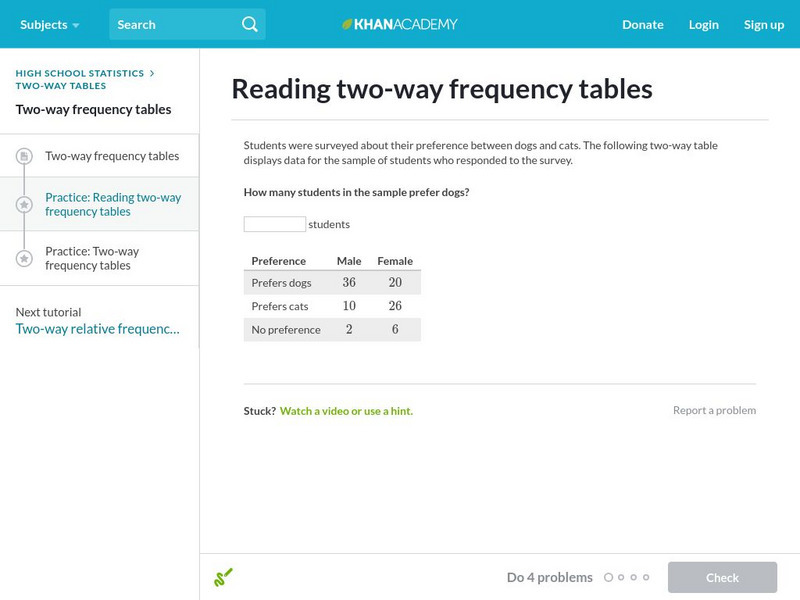
Khan Academy: Reading Two Way Frequency Tables
Practice interpreting two-way frequency tables. For example, what does the cell in the top left tell you? Students receive immediate feedback and have the opportunity to try questions repeatedly, watch a video, or receive hints.
CK-12 Foundation
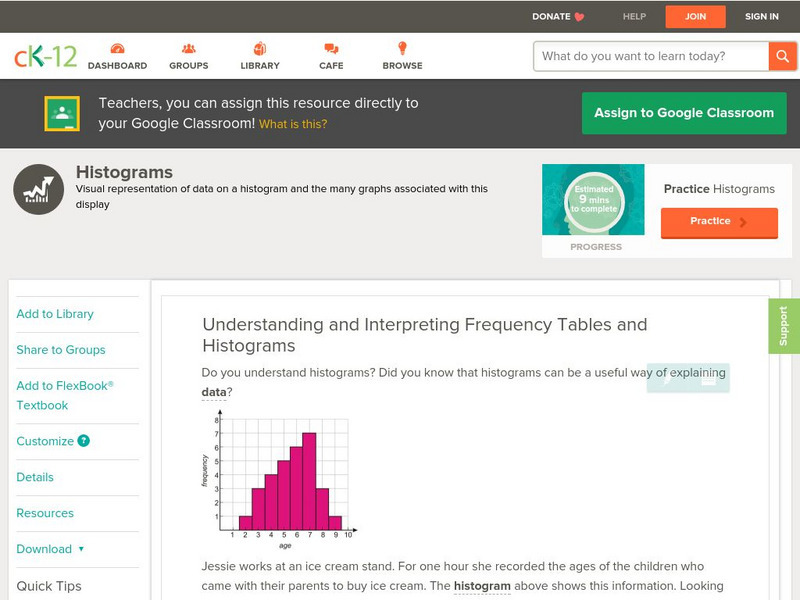
Ck 12: Statistics: Histograms Grade 8
[Free Registration/Login may be required to access all resource tools.] Students will interpret frequency tables and connect data to histograms.
Khan Academy
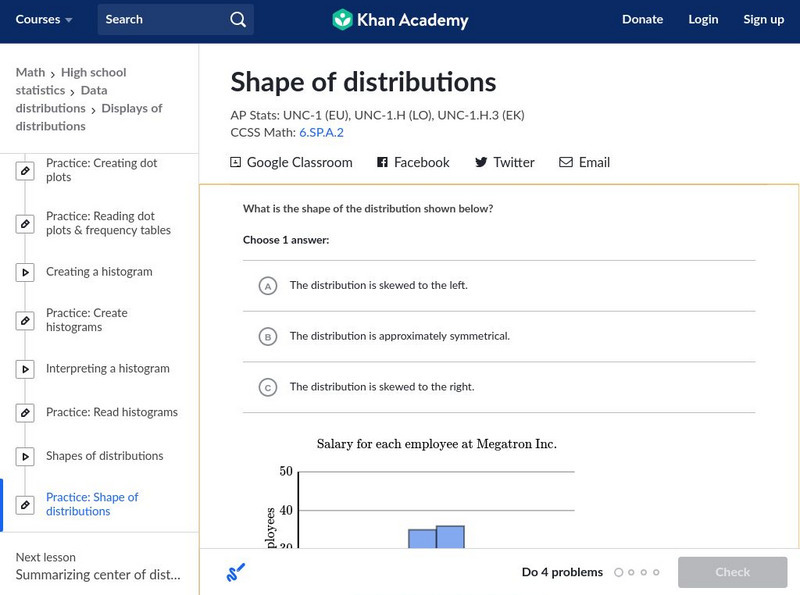
Khan Academy: Shape of Distributions
Practice explaining the shapes of data distributions. Some distributions are symmetrical, perfectly balanced on the left and right. Other distributions are unbalanced. We say they are "askewed" and have "tails." Students receive...
Khan Academy
Khan Academy: Valid Claims
Practice figuring out whether we took a random sample and whether we're able to draw valid conclusions from our data. Students receive immediate feedback and have the opportunity to try questions repeatedly, watch a video or receive hints.
Khan Academy
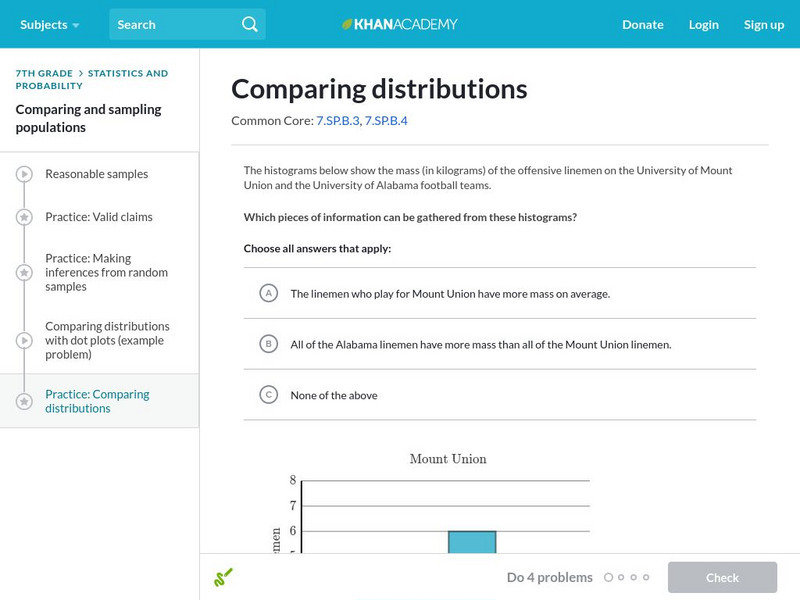
Khan Academy: Comparing Distributions
Try these practice problems comparing distributions.
Khan Academy
Khan Academy: Two Way Tables Review
Two-way tables organize data based on two categorical variables.
Khan Academy
Khan Academy: Conditional Distributions and Relationships
A small private college was curious about what levels of students were getting straight A grades. College officials collected data on the straight A status from the most recent semester for all of their undergraduate and graduate students.
CK-12 Foundation
Ck 12: Interactive Geometry: 11.4 Two Way Frequency Tables
With two pieces of data, learn how to organize the data into a two-way frequency table.
Khan Academy
Khan Academy: Dot Plots and Frequency Tables Review
Dot plots and frequency tables are tools for displaying data in a more organized fashion. In this article, we review how to make dot plots and frequency tables.
Quia
Ixl Learning: Frequency Tables
Brush up on your math skills relating to frequency tables then try some practice problems to test your understanding.
Wolfram Research
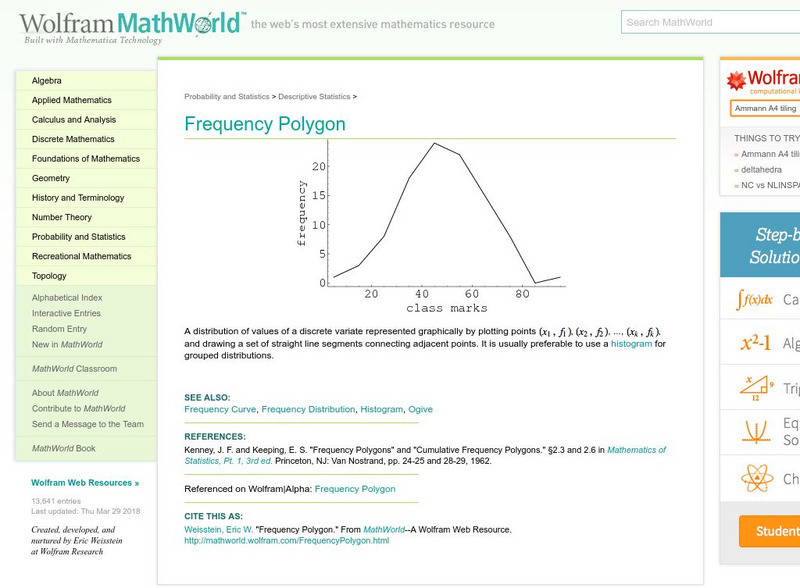
Wolfram Math World: Frequency Polygon
MathWorld provides a general overview of a frequency polygon, complete with a graphical example.
Richland Community College
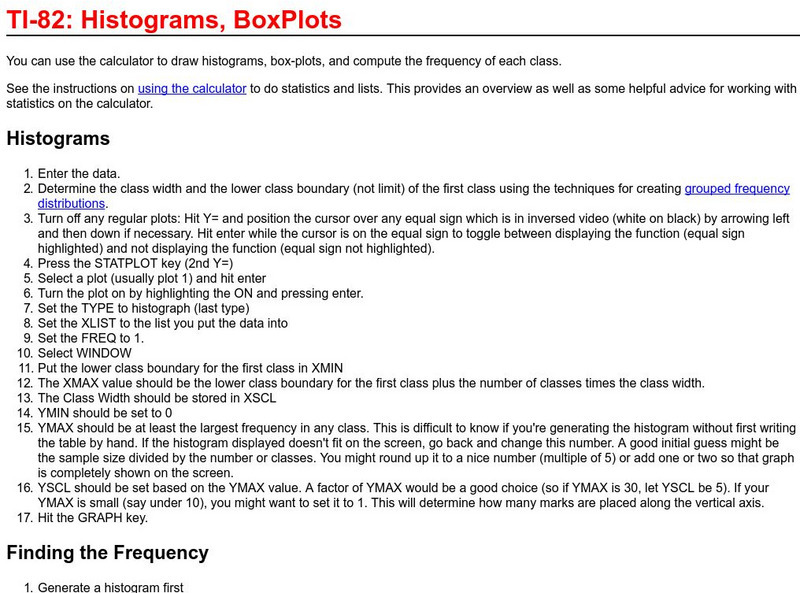
Richland College: Ti 82 Histograms / Box Plots
Richland College provides a step-by-step procedure on how to use a TI-82 to construct histograms and box plots and then use this to find frequency distribution.
Varsity Tutors
Varsity Tutors: Hotmath: Algebra Review: Frequency Distributions
Find a quick, concise explanation of frequency distributions. An example is given and clearly explained.
ClassFlow
Class Flow: Cumulative Frequency Data Handling
[Free Registration/Login Required] Students draw conclusions and engage in tables and charts involving cumulative frequency; a wonderful review of student's knowledge.
Illustrative Mathematics
Illustrative Mathematics: S Cp How Do You Get to School?
All of the upper-division learners (juniors and seniors) at a high school were classified according to grade level and response to the question "How do you usually get to school?" The resulting data are summarized in a two-way table and...
Calculator Soup
Calculator Soup: Percentile Calculator
Enter a data set and the percentile calculator finds the percentile you need.


