Curated OER
Mean, Median, Mode, and Range: Practice
In this line plots worksheet, students make a line plot for each set of data and identify any clusters or gaps. Students then find the mean, median, mode, and range for the first four problems. Students then find n using the given mean,...
PBS
Pbs Learning Media: Triangles
In this video segment [2:01] from Cyberchase, the CyberSquad finds that by arranging triangle tiles they are able to create a path that will allow them to cross a river of hot lava.
Science Education Resource Center at Carleton College
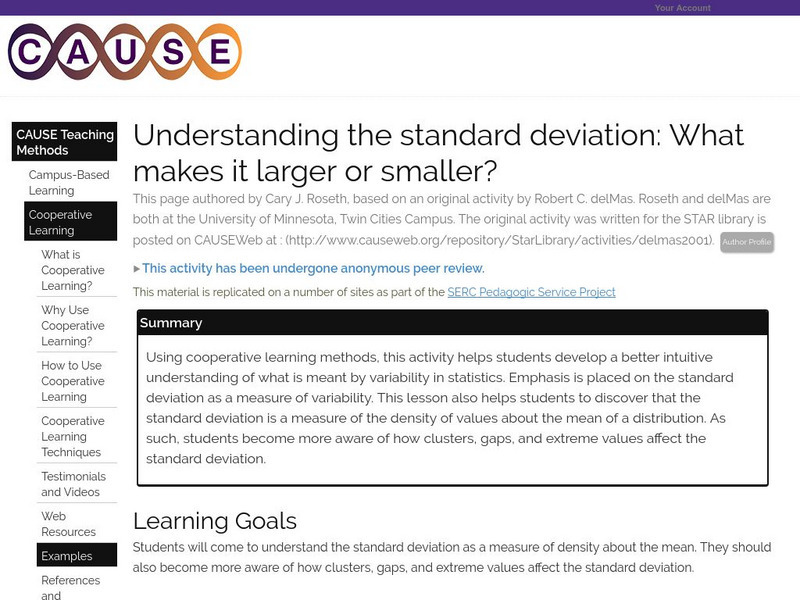
Serc: Understanding the Standard Deviation: What Makes It Larger or Smaller?
Students develop a better intuitive understanding of what is meant by variability in statistics. Emphasis is placed on the standard deviation as a measure of variability.
Khan Academy
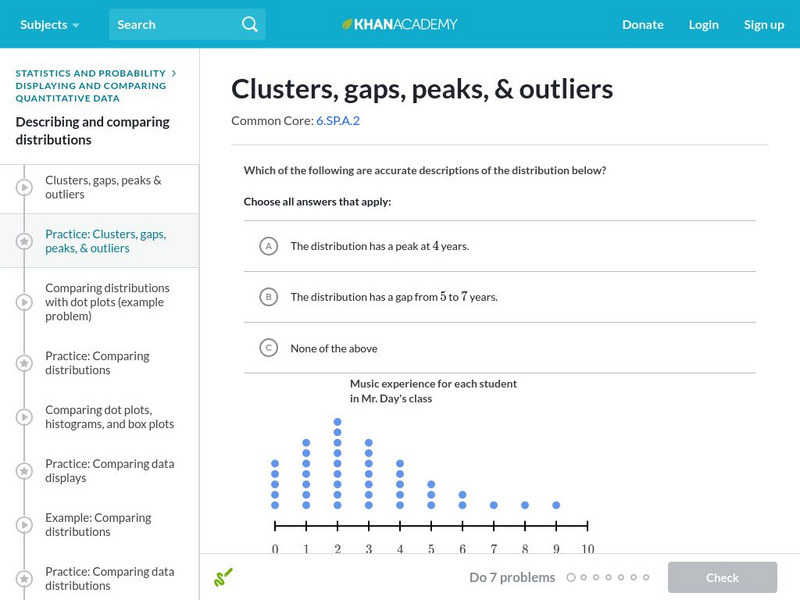
Khan Academy: Clusters, Gaps, Peaks, and Outliers
In this exercise, students practice describing data distributions as clusters, gaps, peaks, and outliers. Students receive immediate feedback and have the opportunity to get hints and try questions repeatedly.
Discovery Education
Discovery Education: Web Math: Using a Number Line
This WebMath site provides an interactive number line "solver." Content includes helpful hint and a full explanation of the mathematical solution.


