Curated OER
Algebra II Calculator Lab
In this quadratic functions learning exercise, learners use their graphing calculators to solve the 9 problems on the page. The questions ask students to graph functions, compare graphs, find the vertex and axis of symmetry and more.
Curated OER
Finding a Line of Best Fit
Pupils engage in the practice of creating a scatter plot with the data obtained from measuring different resting heart rates. The data is used to create the table that is translated into a graph. The instructional activity gives...
Curated OER
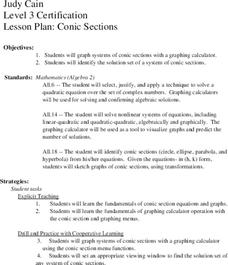
Conic Sections
Learners, while using a graphing calculator, graph systems of conic sections as well as identify their solutions. They complete various word problems dealing with conic sections with their calculators. In addition, students sketch graphs...
Curated OER
TOPSY TURVY MAPS
Eighth graders use the data analyzer and motion detector to collect data and measure distances. They create topographic maps drawn to scale of a given setup and relate the concepts to the creation of historical ocean maps.
Curated OER
Get a Half Life!
Eighth graders use M&M's to experiment with data. They use a graphing calculator to determine the best equation for their data; linear, quadratic or exponential. They analyze the data to find the half-life of their M&M's.
Curated OER
A.P. Exam Calculator Review
Students review ways to use the calculator to graph a function, solve an equation, calculate a numerical derivative, and calculate a definite integral. They practice using their calculator to solve a set of sample exercises. Students...
Curated OER
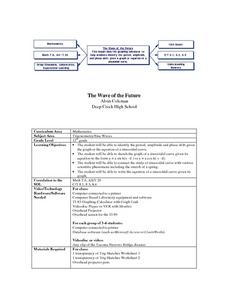
The Wave of the Future
Twelfth graders discuss sine curves and enter equations into their graphing calculator then compare different graphs created on their calculators. They identify the period, amplitude and phase shift given the graph or the equation of a...
Curated OER
Graphing With RXTE
Students use data from the Rossi X-ray Tiiming Explorer (RXTE) satellite to analyze and graph.
University of South Florida
Fcat: Get a Half Life!: Teacher Notes
Students use M&M's and a graphing calculator to collect and graph data. This activity helps them to understand exponential functions and the concept of half-life.
University of South Florida
Florida Center for Instructional Tech: Walking the Plank
Students use weight to collect data and investigate the linear relationship. This activity uses a graphing calculator.
Texas A&M University
Wtamu Virtual Math Lab: College Algebra: Exponential Functions
This tutorial explains exponential functions and provides links pertaining to topics on them. You will learn to use the exponent keys on your calculator, to graph exponential functions, and to solve compound interest problems.
Other
G Calc: Java Online Graphing Calculator
This free online graphics calculator is an excellent resource to aid with studies in algebra, calculus, trigonometry, etc.
GeoGebra
International Geo Gebra Institute: Geo Gebra
The free mathematics software creates interactive learning material that combines geometry, graphing, tables, algebra, statistics, and calculus. Teachers can download the free open source software to enhance their mathematics lessons. A...
Texas Education Agency
Texas Gateway: Solving Linear Equations and Inequalities
When given a table, equation or verbal description, students will solve one- and two-variable equations and inequalities using algebraic steps or graphing methods.
Hofstra University
Hofstra University: Function Grapher
This site contains an actual online function graphing utility. Allows you to type in a function, choose max and min x and y values, zoom in and out, as well as a variety of other features. Just like having a graphing calculator online.
Texas Education Agency
Texas Gateway: Determining Parent Functions (Verbal/graph)
Given a graph or verbal description of a function, the student will determine whether the parent function is quadratic or linear.
Texas Education Agency
Texas Gateway: Collecting Data and Making Predictions
Given an experimental situation, the student will write linear functions that provide a reasonable fit to data to estimate the solutions and make predictions.
Texas Education Agency
Texas Gateway: Analyzing the Effects of Changes in "A" on the Graph Y=ax^2 + C
Given verbal, graphical, or symbolic descriptions of the graph of y = ax^2 + c, the student will investigate, describe, and predict the effects on the graph when "a" is changed.
Calculator Soup
Calculator Soup: Descriptive Statistics Calculator
This is a statistics calculator; enter a data set and hit calculate. Descriptive statistics summarize certain aspects of a data set or a population using numeric calculations. Examples of descriptive statistics include: mean, average,...
University of South Florida
Florida Center for Instructional Tech: Wacky Water World
At this site investigate linear equations with a graphing calculator. Data is gathered from a hypothetical situation of purchasing tickets at a waterpark.
Texas Instruments
Texas Instruments: Differential Equations on the Ti 92 Plus
This activity acquaints students with the features and capabilities of the calculator that are used to study concepts related to differential equations. Students graph and solve a range of differential equation problems.
Texas Instruments
Texas Instruments: Glencoe Algebra 2: Solving Trigonometric Equations
Students will solve equations for the values of x.
Texas Instruments
Texas Instruments: Glencoe Algebra 1: Graphing Calculator Investigation Systems
Students will solve systems of equations.
Texas Instruments
Texas Instruments: Glencoe Algebra 2: Augmented Matrices
Students will solve systems of linear equations.


