Curated OER
Look Into My Eyes!
Students explore collecting, analyzing, and graphing information. They collect data on the various eye colors of their classmates. Students tally the results and create a graph.
Curated OER
Graphing Race Results
Fifth graders graph bike mileage results. In this graphing information lesson plan, 5th graders get into groups, and organize the information they read. Students share how they organized the information with the rest of the class....
Curated OER
Too Many Tulips
In this graphing information instructional activity, students read 6 sentences and then fill in the chart with the appropriate information from the sentences.
Curated OER
Fill in the Graphs
In this graphing information activity worksheet, students use the 6 provided clues to appropriately fill in the blanks in a pie chart.
Curated OER
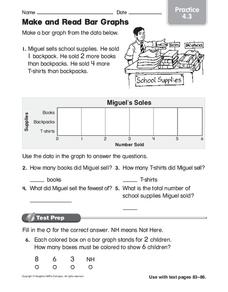
Make and Read Bar Graphs
In this bar graphs worksheet, students make a bar graph about the sale of school supplies with the data presented in one story problem.
Curated OER
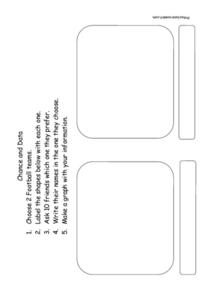
Chance and Data
In this graphing a survey worksheet, learners poll 10 friends to see which of 2 football teams is their favorite and then graph their data results.
Curated OER
Graphing Information from a Data Table
In this graphing worksheet, students solve 12 problems in which data on a table is presented on a bar graph. This page is intended to be an online activity, but may be completed with paper and pencil.
Curated OER
Our Favorites
Students participate in and conduct a survey to determine various class favorites. They collect, organize and display their data, interpret the results, and complete a packet of worksheets to display the information.
Other
The Topic: Charts and Graphs
Brief descriptions of charts and graphs, followed by links to larger sites on the same subject.


