US Department of Education
Nces: Create a Graph: Kids Zone
Make your own pie, bar, line, area or XY graph with this interactive tool. Look for examples of graphs already created from data collected by the National Center for Education Statistics. Complete with a graphing tutorial.
TED Talks
Ted: Ted Ed: Visualizing the World's Twitter Data
Good morning, Twitter! Millions of tweets are sent everyday, and from these tweets, we can gather a lot of information about people's lives: where they travel, when they wake up, and their opinions on pretty much everything. Jer Thorp...
CK-12 Foundation
Ck 12: Statistics: Bar Graphs Grade 7
[Free Registration/Login may be required to access all resource tools.] Make a bar graph to display given data.
CK-12 Foundation
Ck 12: Statistics: Circle Graphs to Display Data Grade 7
[Free Registration/Login may be required to access all resource tools.] Make circle graphs by using given data.
CK-12 Foundation
Ck 12: Frequency Tables to Organize and Display Data Grade 7
[Free Registration/Login may be required to access all resource tools.] Make a frequency table to organize and display data.
CK-12 Foundation
Ck 12: Statistics: Line Graphs Grade 7
[Free Registration/Login may be required to access all resource tools.] Make a line graph to display data over time.
CK-12 Foundation
Ck 12: Statistics: Data Display Choices Grade 7
[Free Registration/Login may be required to access all resource tools.] Associate given conclusions about a set of data given different displays of data.
Sophia Learning
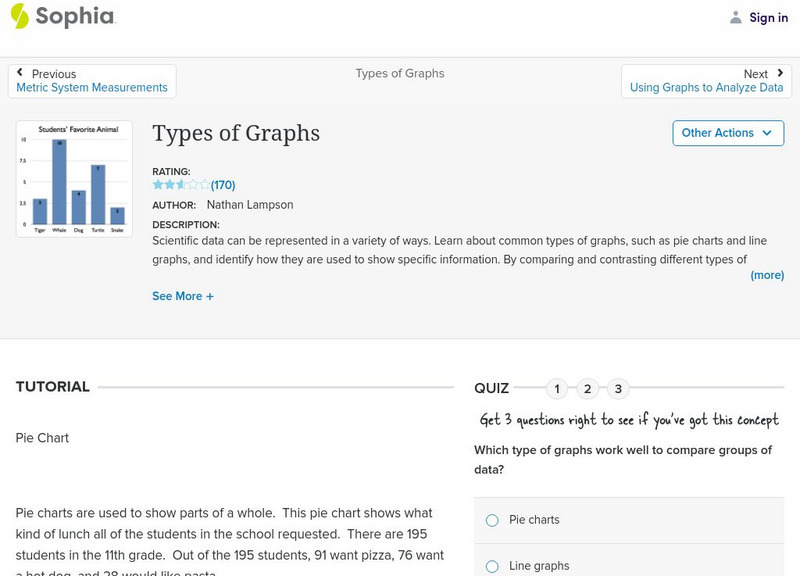
Sophia: Types of Graphs
This presentation allows the learner to visualize the different types of graphs used to display data in scientific investigations.
CK-12 Foundation
Ck 12: Statistics: Multiple Line Graphs
[Free Registration/Login may be required to access all resource tools.] Make multiple line graphs to display and compare given data.
BBC
Bbc: Representing Data
This BBC Math Bite tutorial for line graphs, pictograms, and frequency polygons features an exam in which students draw and interpret statistical diagrams.
Sophia Learning
Sophia: Using Graphs to Analyze Data
This lesson will demonstrate how to analyze and interpret data given in the form of a graph.


