ReadWriteThink
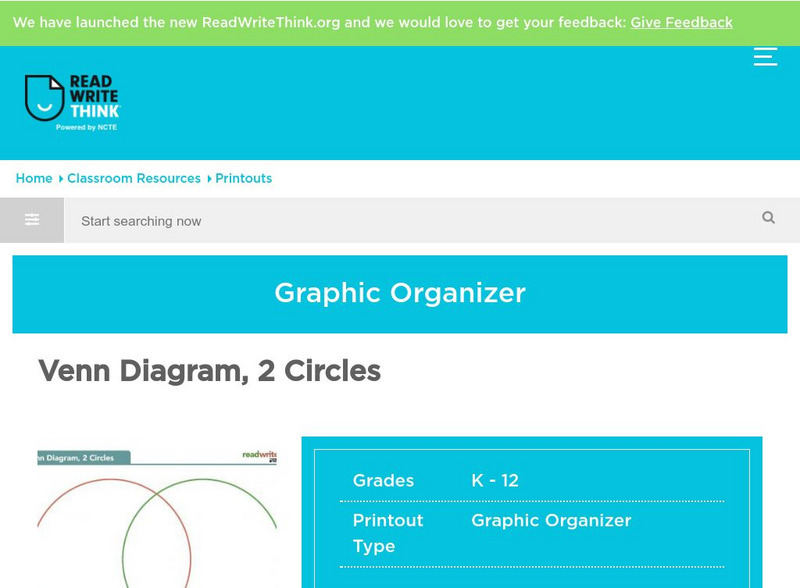
Read Write Think: Venn Diagram, 2 Circles
A printable Venn diagram to use when comparing and contrasting two things or topics. Directions on how to use this graphic organizer as well as lists of teaching ideas and related resources are also provided.
Other
Fdlrs: Thinking Maps: Examples From Brevard Public Schools
See examples of the use of the eight graphic organizers from Thinking Maps. These maps help students organize their learning and identify ways to reflect different kinds of text. The several examples from each grade K-6 show how to use...
Polk Brothers Foundation Center for Urban Education at DePaul University
De Paul University: Center for Urban Education: I Can Locate and Classify Information [Pdf]
A blank T-Chart is provided for students to use as they sort facts into two categories. Students will classify science information with this aid.
Read Works
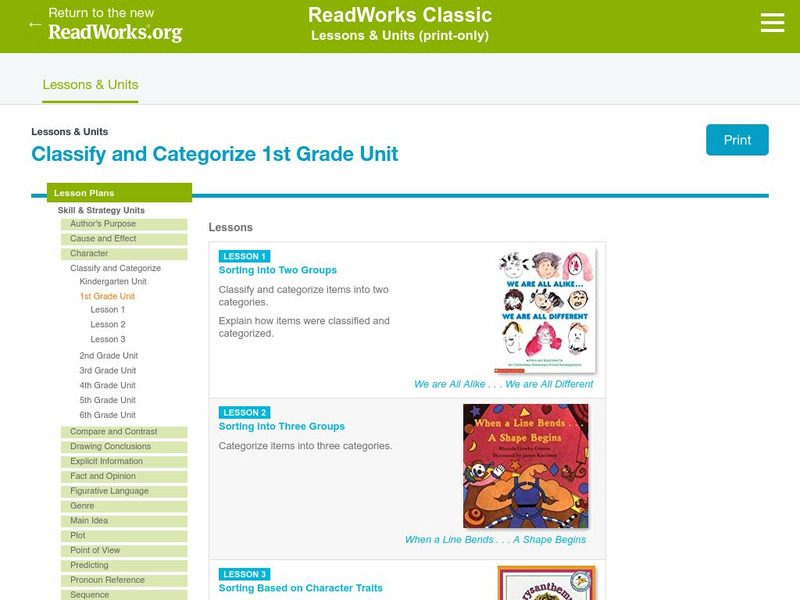
Read Works: Classify and Categorize 1st Grade Unit
[Free Registration/Login Required] A three-lesson unit on classifying and categorizing through which students learn how to sort items into two and three categories and explain how each group is classified. Finally, students categorize...
Read Works
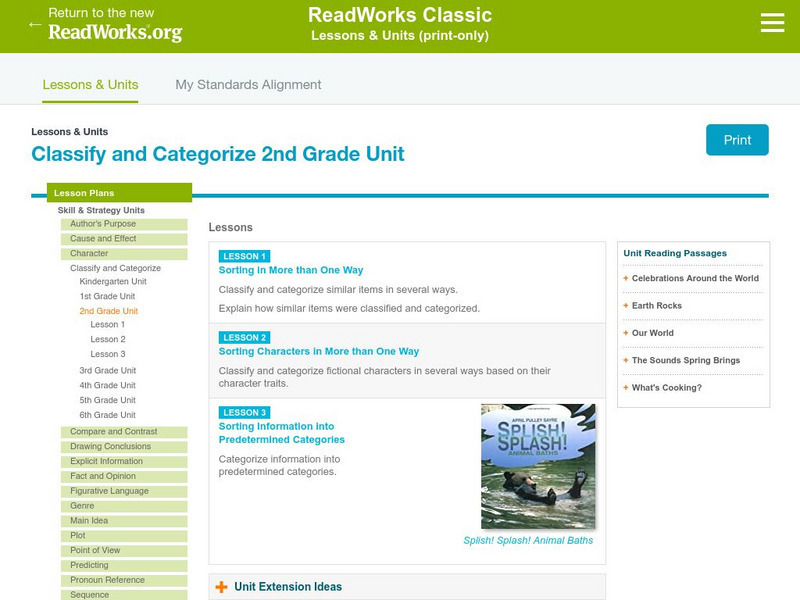
Read Works: Classify and Categorize 2nd Grade Unit
[Free Registration/Login Required] A series of three lesson plans designed to teach young scholars to classify and categorize items, characters, and information. The third lesson is based on the book Splish! Splash! Animal Baths by April...
Wisconsin Response to Intervention Center
Wisconsin Rt I Center: Semantic Maps for Word Learning [Pdf]
Classroom teachers will learn about semantic maps, an engaging instructional strategy tool. Teachers will learn how to implement semantic maps, understand how to measure progress with semantic maps, find research that supports semantic...
ClassFlow
Class Flow: Graphic Organizer Kwl
[Free Registration/Login Required] This graphic organizer is a KWL chart. What do I KNOW? What do I WANT to know? What did I LEARN? It is applicable to any subject area.
ClassFlow
Class Flow: Graphic Organizers
[Free Registration/Login Required] This flipchart is a collection of colorful, graphic organizers including cause and effect, Venn diagram, comparison map, web, KWL, problem-solution chart, story web, story map, and sequence chart.


