Curated OER
Getting Graphs: Researching Genealogy-A Piece of Pie
Third graders research their genealogy. In this math lesson, 3rd graders collect data and create graphs and charts. A presentation of their findings is given.
Curated OER
Math Made Easy
Students evaluate word problems. In this problem solving lesson, students are presented with word problems requiring graphing skills and students work independently to solve.
Curated OER
Line Graphs
Seventh graders create a line graph and identify when to use line graphs. In this line graphs lesson, 7th graders analyze the average temperatures of various cities. Students graph the data they collected.
Curated OER
Graphs
In this Cartesian coordinate plane worksheet, students analyze 4 ordered pairs and locate the place that goes with that point on a graph. Students also write the ordered pair for 4 places shown on the graph. Note: One of the places is a...
Curated OER
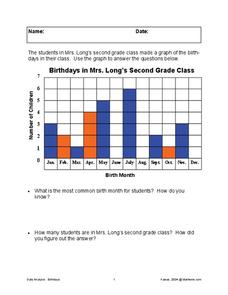
Birthday Graph
In this graphing worksheet, students interpret a graph of "birthdays in Mrs. Long's second grade class" to answer 2 related questions.
Curated OER
Graphs
In this math worksheet, students practice the activity that is directed by the teacher. The graph is filled with the data and titled at the top of the page.
Curated OER
Telephone Time
In this telephone time worksheet, students study, discuss and compare two sets of data when represented on the same graph. Students set up an original graph.
Curated OER
Numeracy Practice- Going Out For Lunch
In this math learning exercise, learners complete the various types of activities that include graphs, data tables, and completing number sentences.
Curated OER
Color Survey
In this mathematical worksheet, students survey twenty people to find out what their favorite color is and then graph out their findings.
Curated OER
Spotlight on Students
First graders participate in social skills activities at the beginning of they school year that including graphing work. Each student acts as the "Top Banana" while other students ask them questions about their likes and dislikes. As a...
Curated OER
Figuring in Football
Students identify and visualize congruent and similar two-dimensional geometric figures. They recognize that rotations, translations, and reflections do not change geometric figures. Students participate in activites in which they...
Curated OER
Representing Data
Students use their math skills to solve real-world situations. In groups, they must work with data and organize it in a chart for use to make different graphs. Individually, they complete different activities and share their results with...
Curated OER
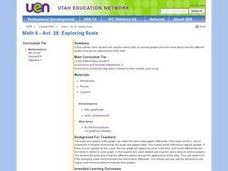
Exploring Scale
Sixth graders discuss how the scale and type of graph can change how the data appears. With a partner, they identify all the information about the graph in a specific amount of time and record them in a journal. To end the lesson, they...
Curated OER
Food Ways - Graphing
Sixth graders choose the appropriate graph to display collected data. They interview each other on what foods they eat. They also interview elders and find out what types of food they grew up eating. They create graphs to display the...
Curated OER
What's Your Favorite Planet?
Fourth graders interpret a graph and make correlations using data. After taking a class survey, 4th graders create a class graph of their favorite planets. Working in small groups, they interpret the information and create at least ten...
Curated OER
Unit 2: Lesson 7
Students are introduced to spreadsheets. They conduct a survey of television viewing time of different shows based on different age categories. Students work in small groups. They collect, data and interpret the data from a survey.
Curated OER
Graphing Sound
Students formulate an understanding of sound as a vibration and draw their graph as carefully as possible on their observation sheet. They also record how they made the sound and and a description of the sound. Finally, students cut out...
Curated OER
Points in the Complex Plane -- Lab
Students review the lecture portion of this lesson. Individually, they graph various points on a complex plane and identify conjugates based on their location on the graphs. They complete a worksheet and review their answers to end the...
Curated OER
Functions and Graphs -- Pattern Detection #1
Students discuss the job of an archaeologist by determining how people have used their environment. Using a graph, they analyze the patterns and functions of Native Americans in Arizona using maize. They work together to answer...
Curated OER
Functions and Graphs -- Pattern Detection #2
Young scholars examine a graph made by archaeologists. In groups, they discuss the role of the size of the animals and how that affects the graph. They compare and contrast the size of animals killed by people 10,000 years ago and 8000...
Curated OER
Using My Nasa Data To Determine Volcanic Activity
Students use NASA satellite data of optical depth as a tool to determine volcanic activity on Reunion Island during 2000-2001. They access the data and utilize Excel to create a graph that has optical depth as a function of time for the...
Curated OER
Snow Cover By Latitude
Students examine computerized data maps in order to create graphs of the amount of snowfall found at certain latitudes by date. Then they compare the graphs and the data they represent. Students present an analysis of the graphs.
Curated OER
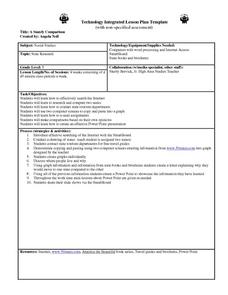
A Stately Comparison
Fifth graders research two United States. They draw each state and contact state tourism departments for travel brochures and guides. They create a graph of where people live and why and a letter explaining why they would move to one...
Curated OER
Statistics and Graphing with Accelerated Math
Pupils create charts and graphs, using a spreadsheet program, of their results from their accelerated math lessons. Students discover how graphs can be used to interpret data in our everyday lives as well as how several different graphs...


