Texas Education Agency
Texas Gateway: Scientific Investigation and Reasoning Data Organization
Using interactive exercises, students will review how to construct tables and graphs in order to organize data.
US Department of Education
Nces: Create a Graph: Kids Zone
Make your own pie, bar, line, area or XY graph with this interactive tool. Look for examples of graphs already created from data collected by the National Center for Education Statistics. Complete with a graphing tutorial.
University of Waterloo (Canada)
Wired Math: Organizing Data Grade 7 [Pdf]
A collection of worksheets that focus on data analysis and organizing data. Includes detailed examples, colorful visuals, and a link to a related game. Acrobat Reader required.
Goodwill
Gcf Global: Excel 2016
A website with 33 links plus a quiz on how to use Microsoft Excel 2016. Topics include Excel 2016 Basics, Working with Cells and Sheets, Formulas and Functions, Working with Data, Doing More with Excel, and Extras.
Goodwill
Gcf Global: Google Sheets
In this tutorial, learn how to use the powerful tools in Google Sheets for organizing, visualizing, and calculating data in a spreadsheet.
Goodwill
Gcf Global: Excel Tips
Learn these Excel tips and tricks so you can do more with this popular spreadsheet program.
CK-12 Foundation
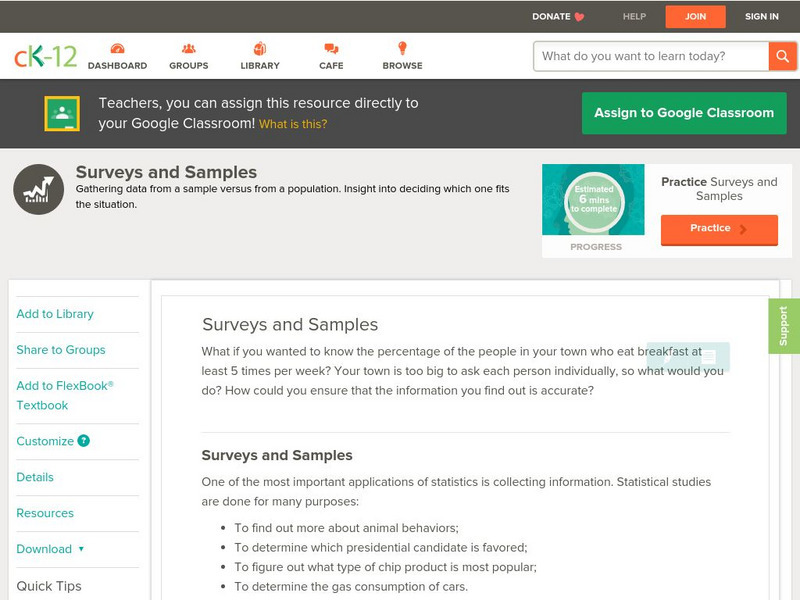
Ck 12: Statistics: Surveys and Sample
[Free Registration/Login may be required to access all resource tools.] Learn how to use surveying and sampling to collect accurate data.
BBC
Bbc Bitesize: Spreadsheets
Spreadsheets are used to store information and data. Once we have our information in a spreadsheet we can run powerful calculations, make graphs and charts and analyse patterns.


![Wired Math: Organizing Data Grade 7 [Pdf] Activity Wired Math: Organizing Data Grade 7 [Pdf] Activity](https://d15y2dacu3jp90.cloudfront.net/images/attachment_defaults/resource/large/FPO-knovation.png)


