CK-12 Foundation
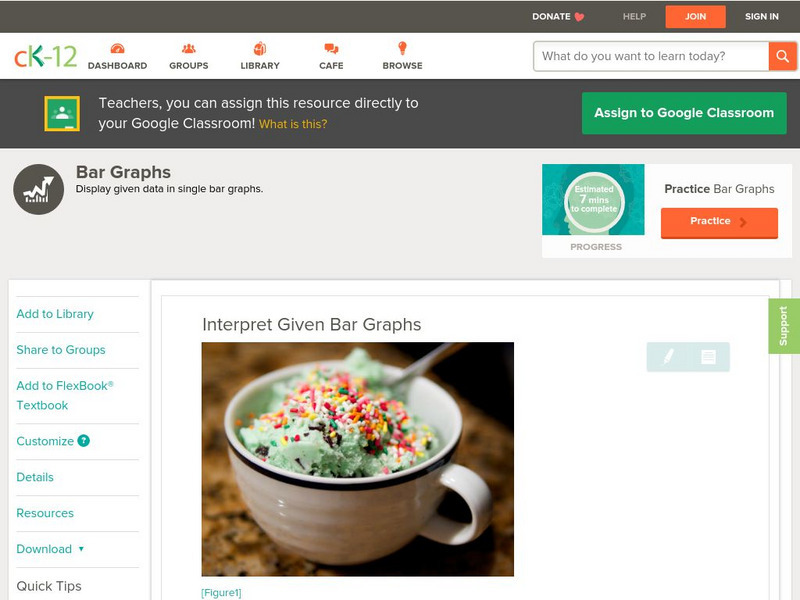
Ck 12: Statistics: Bar Graphs Grade 8
[Free Registration/Login may be required to access all resource tools.] Students will interpret data to understand given bar graphs.
National Council of Teachers of Mathematics
Nctm: Figure This: Wheel of Fortune's Frequent Letters
Did you know that letter guessing on Wheel of Fortune is based on probability? In this challenge taken from one of TV's most popular game shows, discover what consonant or vowel should be guessed next based on letters already given. A...
Texas Education Agency
Texas Gateway: Tea Statistics: Descriptive Statistics: Introduction
In these exercises to introduce descriptive statistics, students will construct a histogram and a box plot, calculate univariate statistics, and interpret the data in the graphs.
Illustrative Mathematics
Illustrative Mathematics: Favorite Ice Cream Flavor
The purpose of this task is for students to represent and interpret categorical data. As a class, students will answer a question with three possible answers and construct a bar graph with the responses. Multiple discussion questions and...
US Department of Education
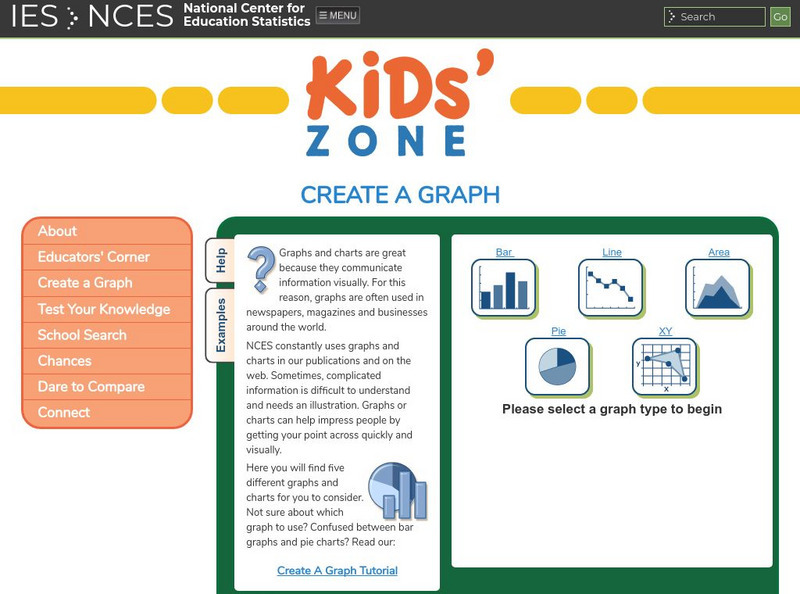
Nces Kids: Create an Xy Graph
This is where you can find a step by step explanation of how to create an XY graph. When you finish each step just click the next tab and you will find the next set of instructions.
Better Lesson
Better Lesson: Comparing the Weather
In order to meet Common Core standards, 2nd graders need to be able to interpret data to solve problems. This lesson provides practice in this area. Included in this lesson are a printable temperature chart and a video of second graders...
ArtsNow
Arts Now Learning: Dance Graphs [Pdf]
Second graders will interpret data on graphs and then use the information to explore dance composition and the form and order of created choreography.
E-learning for Kids
E Learning for Kids: Math: Elephant Plant: Data and Graphs
On this interactive website students practice various math skills using a real-life scenario involving plants. Those skills include interpreting data in a circle graph, interpreting data in a divided bar graph, and interpreting a bar...
National Council of Teachers of Mathematics
Nctm: Figure This: Does It Make a Difference Where You Shop?
A math investigation that uses scatter plots to compare prices of favorite soft drinks. Discover how valuable your skills in organizing and displaying data can be in real life scenarios.
McGraw Hill
Glencoe: Using Graphs to Understand Data Quiz
This is a quiz with five quick questions to check your knowledge of how to use graphs to understand data. It is self-checking.
National Council of Teachers of Mathematics
The Math Forum: Against the Odds Lesson Plan
Teachers can find ideas for their probability lesson plans here. For example, there is an interdisciplinary unit dealing with disabilities and probability as well as one using a field trip to Sea World.
McGraw Hill
Glencoe: Interpreting Data Quiz
This is a quiz with five quick questions to check your understanding of how to interpret data. It is self checking.


