Curated OER
Rockefeller's Revenge: Exxon and Mobil Unite
Study the impact and possible outcomes of the Exxon-Mobil merger in your language arts, social studies, or economics class. Secondary learners evaluate a series of graphs, write a paragraph interpreting the data, and engage in class...
Curated OER
Walking the Plank
This is a cool math activity. Kids collect and interpret data based on a physical act. A board is balanced between a scale and a step, learners record a peer's weight as it decreases while s/he walks further away from the scale. They...
Curated OER
Go Fish
Help learners discover methods to estimate animal population. They will participate in a simulation of catching and tagging fish in order to estimate the fish population. They scoop and count goldfish crackers, record data, and use...
Illustrative Mathematics
Weather Graph Data
Teaching young mathematicians about collecting and analyzing data allows for a variety of fun and engaging activities. Here, children observe the weather every day for a month, recording their observations in the form of a bar graph....
Curated OER
How Soluble Is It?
Is sugar more soluble than salt? Experiment with water and solubility with an elementary science activity. After interpreting data from a bar chart, fifth graders use different types of sugar to determine if the size of sugar particles...
Curated OER
Exercise and the Human Heart
Interpret data and learn about the human heart in one activity! After learning about the way blood flows in the body, fifth graders answer two questions about a graph displaying pulse rate. They then take their own pulses to find the...
Curated OER
Can You Bag It?
Put your class's observational skills to the test with a science experiment about paper and plastic bags. After reading some background knowledge about the materials in plastic grocery bags, third graders interpret a chart to answer a...
Curated OER
Are These Made of Metal?
How can you tell if something is made of metal? Use a table of data and a science experiment to determine which items are made of metal. The experiment requires adult supervision, as it instructs third graders to build an electrical...
Curated OER
A Whale of a Story
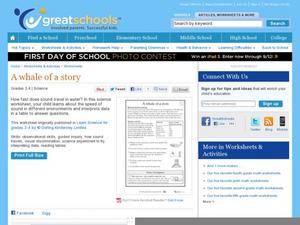
Does sound travel faster in water or in the air? Put the question to the test with a science experiment. After reviewing a table of data, third and fourth graders decide which statements are true and which ones are false. The bottom of...
Curated OER
Cutting Expenses
Learners explore budgeting. In this finance and math lesson, students brainstorm ways in which households could save money. Learners view websites that give cost reducing ideas. Students complete an expense comparison chart and use the...
Curated OER
Interpreting Data, Facts and Ideas from Informational Texts - A Different King of Fuel
Why do we need renewable energy resources? Discuss the energy crisis with your middle and high school classes through interpreting informational texts. An engaging video and a worksheet accompany this plan.
Curated OER
American Indian Math
Upper graders examine Native American culture while practicing mathematical concepts related to patterns and estimation. They will use mental math to add/subtract single digit numbers.
Curated OER
Big Boats Up The River
Using boats along in the Port of Albany as the focus, learners practice adding single-digit numbers and interpreting data. This lesson comes with the worksheets, resource links, and other materials to make it a worthwhile experience.
Curated OER
Add and Subtract with Hudson River shipping
Rivers aren't just a place for animals to live, they also provide industrial transportation. The class will examine the Hudson River on a map, discuss all the commercial vessels that use the River to transport materials, then complete a...
Curated OER
Charts, Maps, and Graphs Lesson on the Holocaust
Students practice interpreting data. In this Holocaust lesson, students research selected Internet sources and examine charts, maps, and graphs regarding the Jewish populations in and out of Europe. Students respond to questions about...
Curated OER
Graphically Speaking
Students discover the links between population and Congressional representation. In this government lesson, students research population statistics and create spreadsheets that compare population to the number of Congress members per state.
Curated OER
Designing a Study
Students explore features to consider when designing a scientific study. For this science research lesson, students examine different methods of data collection and consider which method would be appropriate for determining how many...
Curated OER
Hand Sensitivity
Students experiment with the sense of touch. In this tactile lesson, students determine the most sensitive area of the hand. Students experiment by describing objects through touch only. Students compare the amount of sensory data...
Curated OER
My Test Book: Reading Pie Charts
In this math skills worksheet, students solve 9 multiple choice math problems that require them to read and interpret charts. Students may view the correct answers.
Curated OER
School Bus Minutes
For this interpreting data worksheet, students examine table regarding time spent on the school bus. Students respond to 5 short answer questions that require them to read the data and use their problem solving skills.
Curated OER
Interpreting Data
In this math problem solving worksheet, students read a story problem and interpret the data presented in order to respond to 4 questions.
Curated OER
Reading Frequency Tables
In this data interpretation instructional activity, students record the data from 10 examples into frequency tables. They group 10 more data sets, and make a frequency table for each.
Curated OER
Ocean Temperatures
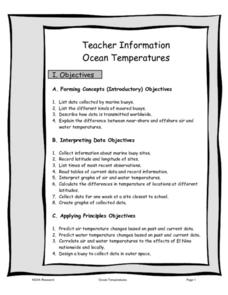
Students list data collected by marine buoys and the different kinds of moored buoys. They describe how data is transmitted worldwide. They explain the difference between near shore and offshore air and water temperatures.
Curated OER
Icebergs: Relationship of Ice to Water
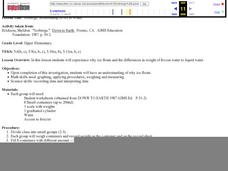
Students experience why ice floats and the differences in weight of frozen water to liquid water. Students explore why ice floats. They use math skills such as: graphing, applying procedures, weighing and measuring. Students also use...


