PBS
Pbs Kids Afterschool Adventure!: Operation: All About Us Activity Plan
It's time to stand in the spotlight! During this Afterschool Adventure, children will learn about and practice a variety of math skills as they gather information about their favorite subject-themselves! Children will start out by...
PBS
Pbs Learning Media: Virtual Professional Learning Series
Our Virtual Professional Learning Series is created for teachers-by teachers-to bring together content experts and educators from all backgrounds. With an emphasis on fun, engaging, accessible, and free tools for classrooms, these...
Houghton Mifflin Harcourt
Holt, Rinehart and Winston: Homework Help Independent Practice: Measures of Central Tendency
Get independent practice working with the mean, median and mode. Each incorrect response gets a text box explanation and another try. Correct responses are confirmed.
National Council of Teachers of Mathematics
The Math Forum: Seventh Grade Mathematics: Data Sense
This site has some interesting ways to collect and evaluate data. There are some activities about note taking, spreadsheets, surveys, and a cool bridge construction project. Teachers may want to use this site as a resource for some...
University Corporation for Atmospheric Research
Ucar: Project Sky Math
Teachers will be interested to explore the SkyMath module, and the 16 classroom activities at this site. In this program, students will collect and record real-time weather data to analyze. Data analysis, graphing, number relationship,...
National Council of Teachers of Mathematics
The Math Forum: A Collection of Secondary Math Units
Teachers of grades 9-12 can explore these seven math units for their classes. Data collection and analysis, problem solving with spreadsheets, and linear transformation are just a few of the topics covered here.
Texas Instruments
Texas Instruments: Math Today for Ti Navigator System More of u.s.
Using the USA TODAY Snapshot, "More of U.S.," students will learn how to interpret data presented in a graphical form. Students will determine the rate of change (slope) and build a linear model (y = mx + b) from this data. The model...
Texas Instruments
Texas Instruments: Data Analysis
Students learn to design data investigations, describe data, and draw conclusions. They learn to choose the best type of graph, graph and interpret the data, and look for patterns and trends. They also use the calculator to investigate...
PBS
Pbs: Mathline Creature Feature Lesson Plan [Pdf]
An interdisciplinary math, science, and language arts lesson that engages students in an exploration of statistics. Through a study of various forest climates, students utilize data collection and analysis, classification, and graphing....
PBS
Pbs Mathline: Sand Babies (Pdf) [Pdf]
In this engaging activity, students use a variety of measurement strategies in creating their own Sand Babies. Students explore standard and non-standard measurements, area, data collection and analysis, and graphing. Adaptations are...
Gilder Lehrman Institute of American History
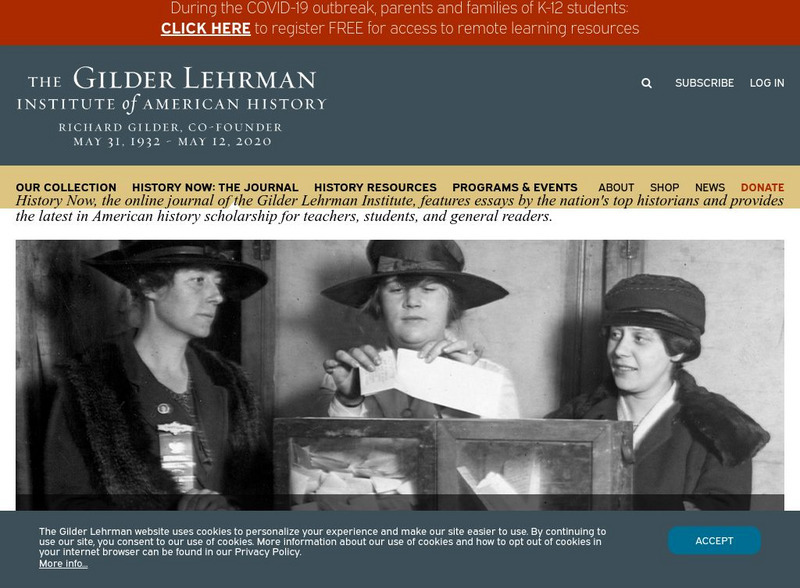
Gilder Lehrman Institute: History Now: When the Past Speaks to the Present: Thomas Jefferson,sally Hemings
[Free Registration/Login Required] An article about the need for careful interpretation of historical sources, especially in the area of slavery.
NPR: National Public Radio
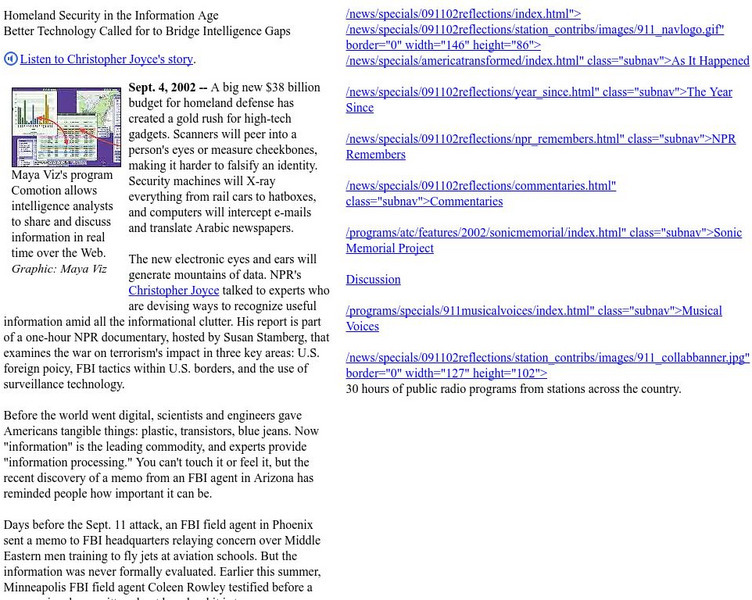
Npr: Homeland Security in the Information Age
This site provides the story detailing new attempts at sorting and using the large quantities of data generated by security measures in the information age. (4 September 2002)
Other
Global Grocery List Project: Homepage
At this site from the Global Grocery List Project, students collect data on the prices of common grocery items and submit their findings. They can then compare the data they collected to data from students around the world. There are...
Quia
Quia: Reading Charts and Graphs Quiz
This 25-question quiz asks students to read various kinds of charts and graphs and to select the correct answers to the questions. Immediate feedback is provided after each question. Java is required.
Microsoft
Microsoft Education Lesson Plan: Candy Is Dandy
Explore color distribution of M&M candies using this detailed lesson plan. An engaging integrated lesson that requires understanding of spreadsheets and formulas, and logical reasoning. Links to related websites.
University of Cambridge
University of Cambridge: Maths and Sports: Reaction Timer
Whether you're responding to a starting pistol or hitting a ball served by your opponent, reaction times are enormously important in sport. This activity includes both an interactive computer test of reaction times and suggestions for a...
CK-12 Foundation
Ck 12: Statistics: Displaying by Type of Data Grade 8
[Free Registration/Login may be required to access all resource tools.] Create and use different data displays to analyze and draw conclusions about different sets of data.
Gilder Lehrman Institute of American History
Gilder Lehrman Institute: History Now: A Look at Slavery Through Posters and Broadsides
[Free Registration/Login Required] In this lesson, students will examine posters and broadsides from the 1800s to examine attitudes about slavery at that time.
US National Archives
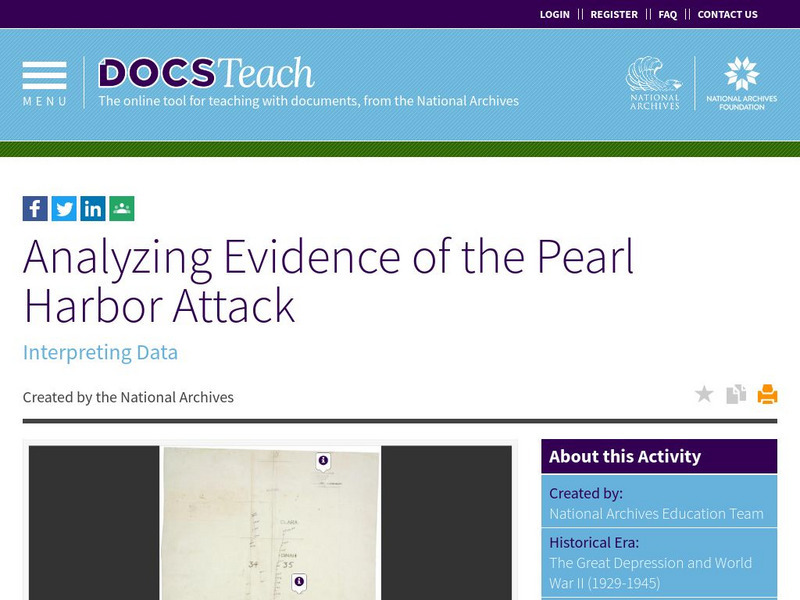
Docs Teach: Analyzing Evidence of the Pearl Harbor Attack
This activity is intended to get students thinking about where information comes from, how it is presented, how its presentation affects understanding, and how information is used. Because the featured document relates to the Japanese...
National Council of Teachers of Mathematics
Nctm: Figure This: Does Drinking Soda Affect Your Health?
Try this "Real world," challenge taken directly from the today's health journals. Use your problem solving, data analysis, and number sense skills to figure out if soda intake among teenage girls is related to incidences of broken bones....
National Council of Teachers of Mathematics
Nctm: Figure This: Census
Try this real world challenge that focuses on data collection, data analysis, and problem solving with information from the U.S. Census Bureau. Discover how these skills are applied in real life situations in this one page activity from...
McREL International
Mc Rel: Glue Polymer (Whelmer #15 Learning Activity)
An easy to do activity that investigates the basic principles behind chemical bonding. The activity is written in lesson plan format that meets NSES standards.
University of North Carolina
University of North Carolina Writing Center Handouts: Statistics
When presenting an argument, the use of statistics to support a point can be very effective. This handout offers advice on both how to read statistics so that you understand exactly what they mean, and how to use them in your argument so...
National Council of Teachers of Mathematics
Nctm: Figure This: Do Women Live Longer Than Men?
Use this site to figure out if women really do live longer than men. A math challenge taken from today's health journals that explores data collection, data analysis, patterns, and graphing skills. Learn how mastering these skills can be...


