Curated OER
Data Handling
In this data handling instructional activity, learners explore multiple ways to represent data. They create stem and leaf plots, histograms, and bar charts. Students examine and interpret diagrams and statistics. This eleven-page...
Curated OER
Frequency Histograms, Bar Graphs and Tables #3
In this frequency histograms worksheet, students examine bar graphs, histograms and tables. They identify the model of information that best matches the statistics. This three-page worksheet cotnains two multiple-choice problems. ...
Curated OER
Bar Graphs and Histograms
In this bar graphs and histograms worksheet, students create bar graphs and histograms from given information. They interpret graphs. This one-page worksheet contains 6 multi-step problems.
Curated OER
Organizing and Interpreting Data
In this organizing and interpreting data activity, learners solve and complete 10 different problems related to reading various data tables. First, they complete the 3 charts shown with the correct tally amount, frequency amount, and...
Curated OER
Histograms and Statistical Graphics
In this statistics worksheet, students solve 6 data problems. They construct a histogram of given data, they create a frequency polygon, and a stem and leaf diagram. Students create a dot plot and a pie chart for given data sets. On the...
Curated OER
Histograms and Bar Graphs
Students are introduced to histograms, bar graphs, and the concept of class interval. They use an activity and three discussions with supplemental exercises to help students explore how data can be graphically represented (and...
Curated OER
Exercise Those Statistics!
Students participate in various activities, measuring their pulse rates and recording the data. They analyze the statistical concepts of mean, median, mode, and histograms using the data from the cardiovascular activities.
Curated OER
Introduction to Descriptive Statistics with Mode, Median, Mean and Range
Learners complete several games and experiments, tally and graph their results. They figure the mean, median, range and/or average of their graphs to describe class results. They consider which statistic best represents the data at hand.
Curated OER
Surveying During a Basketball Game
Tenth graders conduct a survey at a high school basketball game. They compile and present the data as histograms or bar graphs.
PBS
Pbs Learning Media: Harry's Allergy
Harry keeps track of the number of times he sneezes in certain locations to try to diagnose the cause of his allergy in this video segment from Cyberchase.
Shodor Education Foundation
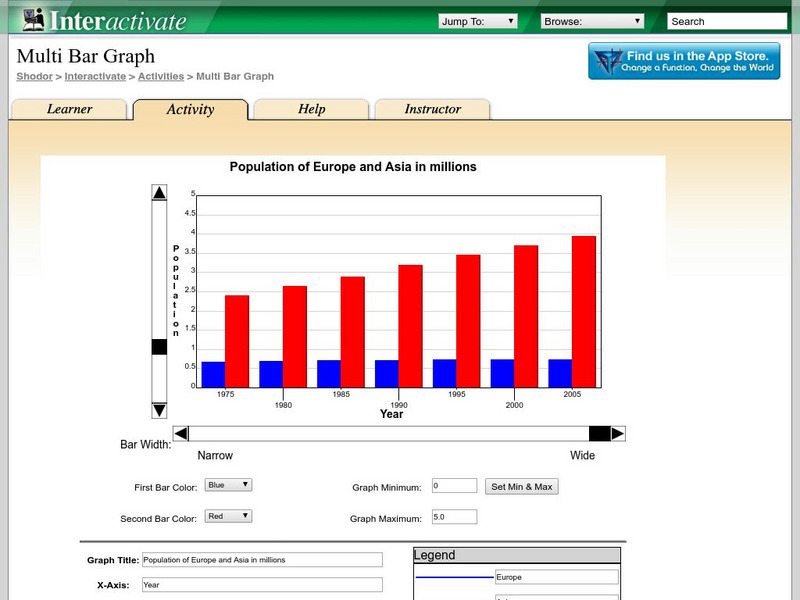
Shodor Interactivate: Multi Bar Graph
The interactive learning activity allows students to manipulate a double bar graph. Teacher resources are included.
PBS
Pbs Learning Media: Restocking Shoes
In this video from Cyberchase, Bianca uses data on past shoe sales to help her decide what quantities of each size she should order in the next shipment.
Other
Online Statistics Education: Graphing Distributions [Pdf]
This is the second chapter of a statistics e-text developed collaboratively by Rice University, University of Houston Clear Lake, and Tufts University. It looks at many different types of data displays and the advantages and...
Oswego City School District
Regents Exam Prep Center: Displaying Data
Use this lesson, practice exercise, and teacher resource in planning instruction on displaying data. In the lessons, you'll find definitions and examples of ways to collect and organize data, quartiles, and box-and-whisker plots, as well...
Cuemath
Cuemath: Histograms
A comprehensive guide for learning all about histograms with definitions, solved examples, and practice questions.
Scholastic
Scholastic: Shake, Rattle & Roll
Middle schoolers will learn and reinforce skills for creating and analyzing scatterplots and histograms; using cost-benefit analysis to make predictions from data and using tree diagrams to understand outcomes of events.
BSCS Science Learning
Bscs: Budburst Lilac Festival
In this Inquiry, students predict the best date to host a lilac blossom festival so that lilacs are in full bloom in the city where students live. Students are introduced to Project Budburst, a citizen science project in which volunteers...
Wolfram Research
Wolfram Math World: Histogram
This MathWorld site offers a clear definition and examples of a histogram.
Wolfram Research
Wolfram Math World: Frequency Distribution
This site from MathWorld provides a general overview of frequency distribution, complete with a bar graph and explanatory text.
University of Georgia
University of Georgia: Definitions in Statistics
This site contains definitions to use in statistics and ways to collect data.
Texas Instruments
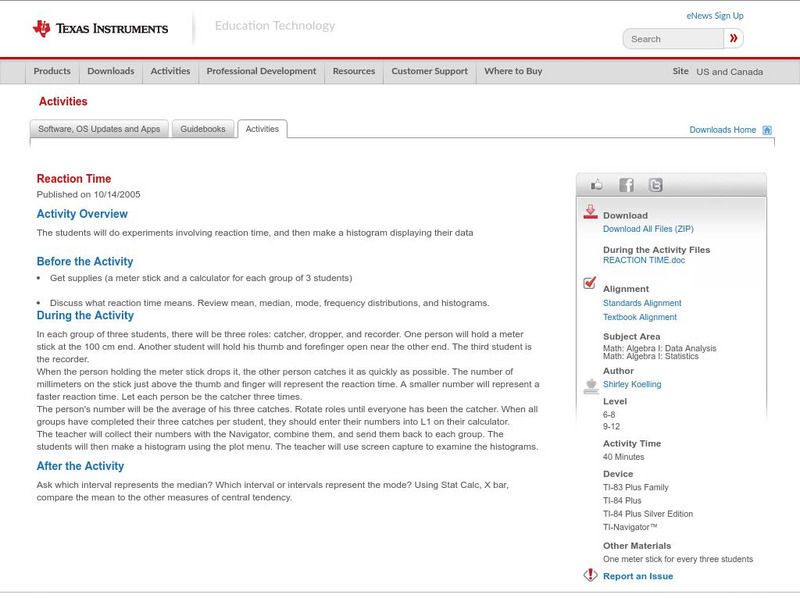
Texas Instruments: Reaction Time
The students will do experiments involving reaction time, and then make a histogram displaying their data.
Beacon Learning Center
Beacon Learning Center: Kinds of Graphs
An interactive web lesson introduces five types of graphs to students and allows them to practice matching the names to examples.
Stefan Warner and Steven R. Costenoble
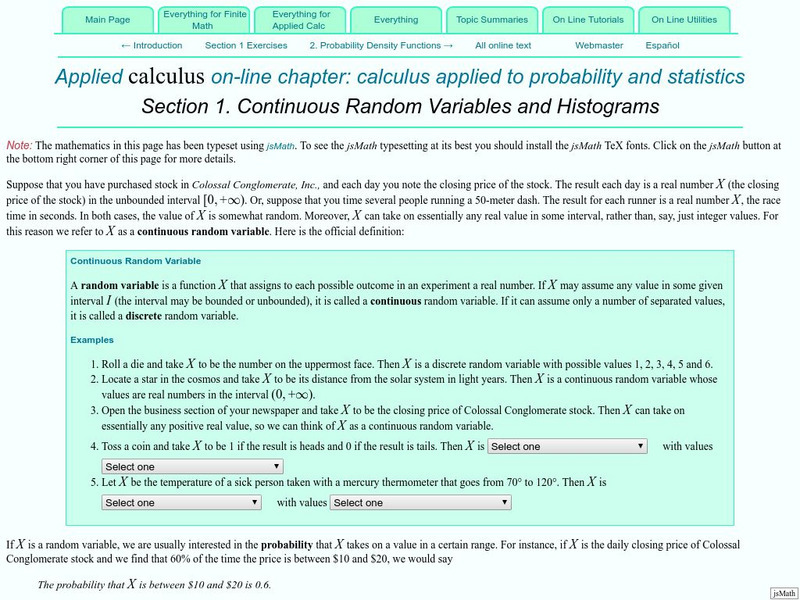
Finite Mathematics & Applied Calculus: Continuous Random Variables and Histograms
Students learn about random variables and histograms. Topics explored are continuous random variables, discrete random variables, probability, and frequency distributions. The tutorial investigtes the statistics concepts through class...


