Curated OER
Chapter 7 Word Search
In this statistics worksheet, students locate and identify various vocabulary terms related to mathematics and statistics. There are seven words located in the puzzle to find.
Curated OER
The Human Line Plot
Fifth graders collect data and use charts and line plots to graph data. Through class surveys, 5th graders collect data concerning a particular subject. They graph their data using a line graph. Students make inferences and predictions...
Curated OER
Graphing in an Experimental Context
Seventh graders discuss the importance of being able to represent scientific data in the form of graphs. They comprehend the differences between a bar graph and a line graph. Students identify the type of data with which each graph...
Curated OER
RCX Car Line Graph
Learners develop a line graph based on distances that an RCX car drives in specified amounts of time. They then are given a specific amount of time for the car to drive and be asked to extrapolate the car's distance from the graph.
Curated OER
BUS: Farming: It's A Fact (Ag)
Pupils create two different types of graphs from the information in the "Farm Facts" booklet (i.e., bar graph, pie chart, etc.). They calculate where your food dollars are spent (on and off farm).
Curated OER
Dealing With Data
Students collect, organize, and display data using a bar graph, line graph, pie graph, or picture graph. They write a summary describing the data represented and compare the graph to another graph in the class.
Curated OER
Which Graph is best?
Students use commercial software to organize and visually display data to draw conclusions; students use graphing software to create several types of graphs illustrating the number of each color of M&M's in one bag.
Curated OER
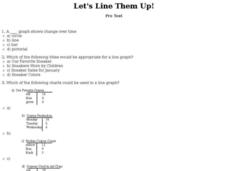
Let's Line Them Up!
For this line graph worksheet, students read through the problems about graphing and line graphs. Students select the best answer to solve the 10 online questions.
Curated OER
"Graph It"
Learners work in teams to conduct short surveys of their classmates. They show their results using at least two different types of graphs.
Students separate into teams and are asked that each team to choose something that they are...
Curated OER
Charting Weight
Sixth graders record the weight of themselves and 3 family over a week, and then use that data to compile 2 bar graphs and 4 line graphs and answer a series of questions.
Curated OER
Usage and Interpretation of Graphs
Students review graphing and use processing skills to solve problems.
PBS
Pbs Learning Media: A Flooding Threat
In this video segment from Cyberchase, the CyberSquad uses a graph to estimate how much the water level will rise in the Sensible Flats reservoir.
Beacon Learning Center
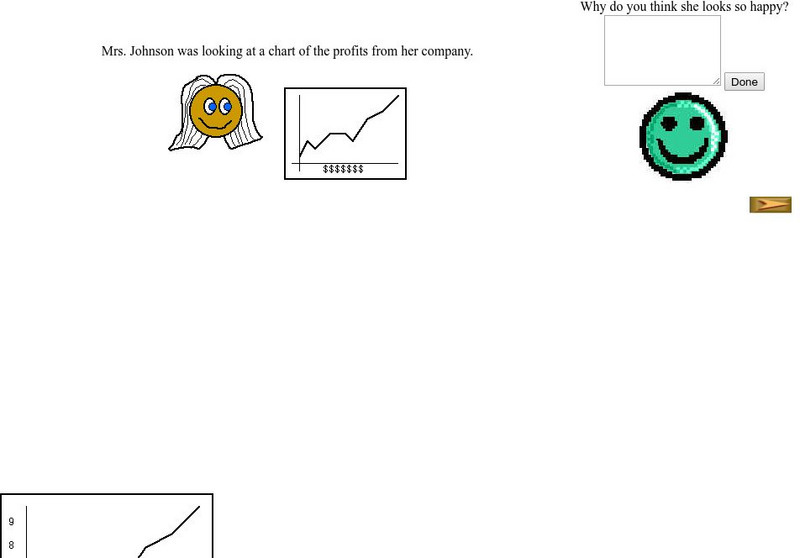
Beacon Learning Center: Interpreting Line Graphs
This site is a lesson on creating and interpreting a line graph. It explains how a line graph is created and then asks questions about what is learned from the data. Students type in open responses, and answers and feedback follow.
Beacon Learning Center
Beacon Learning Center: Push Ups
This is a tutorial on line graphs including when, how, and why one might choose to use them and how to interpret the data when it is complete. This one is to reach a goal for the number of push ups needed to win the Presidential Fitness...
NASA
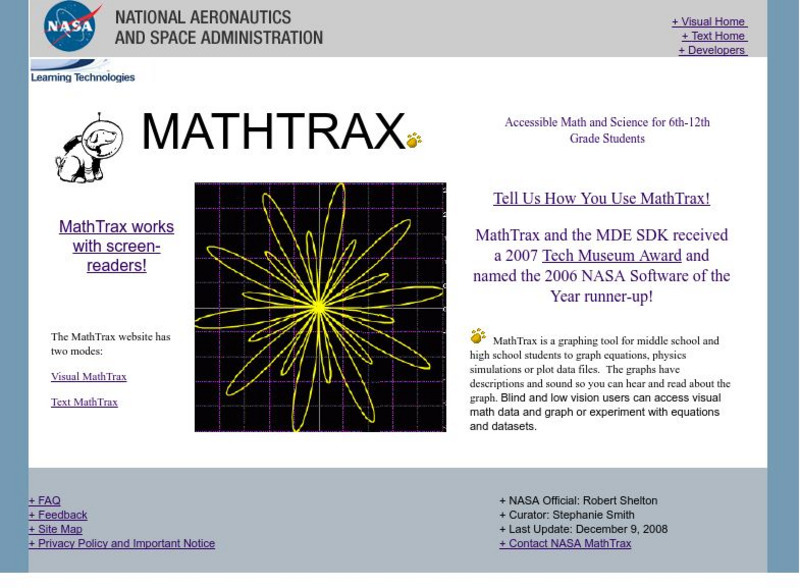
Nasa: Mathtrax Graphing Tool
NASA: Mathtrax is a graphing tool where the graphs includes descriptions and sounds. It is also adaptable for students who have visual accomidations.
McGraw Hill
Glencoe: Self Check Quizzes 1 Using Bar and Line Graphs
Use Glencoe's randomly generated self-checking quiz to test your knowledge of using bar and line graphs. Each question has a "Hint" link to help. Choose the correct answer for each problem. At the bottom of the page click the "Check It"...
Teachnology
Teachnology: Survey Teaching Theme
Survey Theme provides an excellent collection of free sample worksheets, teacher resources, lesson plans and interactive media for grades k-12.
Teachnology
Teachnology: Survey Teaching Theme
Survey Theme provides an excellent collection of free sample worksheets, teacher resources, lesson plans and interactive media for grades k-12.
McGraw Hill
Glencoe: Self Check Quizzes 1 Analyzing Graphs
Use Glencoe's randomly generated self-checking quiz to test your knowledge of how to analyze graphs. Each question has a "Hint" link to help. Choose the correct answer for each problem. At the bottom of the page click the "Check It"...
Other
Online Statistics Education: Graphing Distributions [Pdf]
This is the second chapter of a statistics e-text developed collaboratively by Rice University, University of Houston Clear Lake, and Tufts University. It looks at many different types of data displays and the advantages and...
US Department of Education
National Center for Education Statistics: Create a Graph Tutorial
This tutorial walks students through how to create different types of graphs using the Create a Graph tool available on the website. Covers bar graphs, line graphs, pie charts, area graphs, scatter plots, and dependent and independent...
Government of Alberta
Learn Alberta: Math Interactives: Exploring Election Data
Using actual Alberta provincial election results, students have the opportunity to interpret election data using a variety of graph types. Pictographs, line graphs, bar graphs, circle graphs, and data tables are covered in this...
Government of Alberta
Learn Alberta: Math Interactives: Exploring Data Display and Graphs
This multimedia Learn Alberta math resource focuses on graphing data. In the video portion, students will see how math is involved in the display of merchandise in stores. The accompanying interactive component provides an exploration...
Cuemath
Cuemath: Line Graphs
A comprehensive guide for learning all about line graphs with definitions, their sections, how to read and create graphs, solved examples, and practice questions.


