Cuemath
Cuemath: Linear Graph
A comprehensive guide for learning all about linear graphs with definitions, properties, their equations, how to plot or analyze them, solved examples, and practice questions.
PBS
Pbs Learning Media: Curious George Stem: Graphing Lesson Plan
A hands-on lesson plan where students compare and analyze data from their graphs.
E-learning for Kids
E Learning for Kids: Math: Elephant Plant: Line Graphs and Mean
Many plants are sold in the garden center. But how many exactly?
PBS
Pbs Learning Media: Decreasing Water Levels
The CyberSquad creates a line graph to help tell the story of the decreasing water levels in Sensible Flats in this video segment from Cyberchase.
PBS
Pbs Learning Media: Keeping Track of the New York City Marathoners
In this video segment from Cyberchase, Bianca figures out a way to count the thousands of runners in the New York City Marathon.
University of Illinois
University of Illinois: Line Graphs
Line graphs are shown and explained here. You can learn what kind of data is best represented using a line graph. There are also line graphs with questions and answers available to help you learn how to read them.
US Department of Education
Nces Kids: Creating an Area Graph
This is where you will find step by step directions explaining how to create an area graph. Complete each step and click on the next tab. Directions are simple and clear.
US Department of Education
Nces: Create a Graph: Kids Zone
Make your own pie, bar, line, area or XY graph with this interactive tool. Look for examples of graphs already created from data collected by the National Center for Education Statistics. Complete with a graphing tutorial.
Texas Instruments
Texas Instruments: Mc Dougal Littell Middle School Math: Making Data Displays
Students will create data displays using a scatter plot and a line graph of the data and a circle graph of survey data.
Texas A&M University
Wtamu Virtual Math Lab: Beginning Algebra: Reading Graphs
A good introduction to reading bar, line, and double line graphs, and drawing and reading Venn diagrams. Contains definitions and examples of these types of charts and graphs as well as practice exercises that ask you to answer questions...
Beacon Learning Center
Beacon Learning Center: Kinds of Graphs
An interactive web lesson introduces five types of graphs to students and allows them to practice matching the names to examples.
The Math League
The Math League: Ratio and Proportion
This tutorial provides definitions and examples of ratios and proportions and features comparing ratios and converting rates.
PBS
Pbs Mathline: Button, Button Lesson Plan [Pdf]
An integrated math and language arts activity focusing on statistics. Young scholars explore the concepts of estimation, data collection, data analysis, classification, graphing, and counting through the reading of the Button Box by...
PBS
Pbs Teachers: Galileo's Battle for the Heavens Plotting Sun Spots
In this activity, students follow in Galileo's footsteps as they examine the nature of sunspot cycles, define solar minimum and solar maximum, and graph data for a solar cycle. Then they will predict the next solar maximum and when the...
The Franklin Institute
Frankin Institute Online: Group Graphing
This site from The Franklin Institute explores how to make a simple graph using a spreadsheet to portray survey data. It also gives a set of interesting sports-related web sites so that students can get statistical inforamtion.
Other
Tulpehocken Area School District: Graphing and Analyzing Scientific Data
Student worksheet with explanation of pie, bar, and line graphs, the parts of a graph, and the definition of mean, median, and mode. This summary is followed by an exercise for each type of graph within a scientific context.
University of Cambridge
University of Cambridge: Maths and Sports: The Home Advantage
In the 2008 Beijing Olympics the UK finished 4th in the total medal count. How might we do in 2012, and does the country hosting the Olympics have an edge?
Mangahigh
Mangahigh: Data: Using Line Graphs
This site provides students practice with the concept of line graphs. Students can learn about the topic by completing an interactive tutorial. Students can then take a ten question timed test to practice the skill.
CK-12 Foundation
Ck 12: Statistics: Broken Line Graphs
[Free Registration/Login may be required to access all resource tools.] Covers creating and interpreting broken-line graphs.
CK-12 Foundation
Ck 12: Statistics: Double Line Graphs
[Free Registration/Login may be required to access all resource tools.] Construct and interpret double line graphs.
CK-12 Foundation
Ck 12: Statistics: Line Graphs Grades 9 10
[Free Registration/Login may be required to access all resource tools.] Make a line graph to display data over time.
CK-12 Foundation
Ck 12: Statistics: Line Graphs Grade 7
[Free Registration/Login may be required to access all resource tools.] Make a line graph to display data over time.
Math Is Fun
Math Is Fun: Data Graphs
Create and customize a bar graph, line graph, or pie chart based on a set of data and print it out.
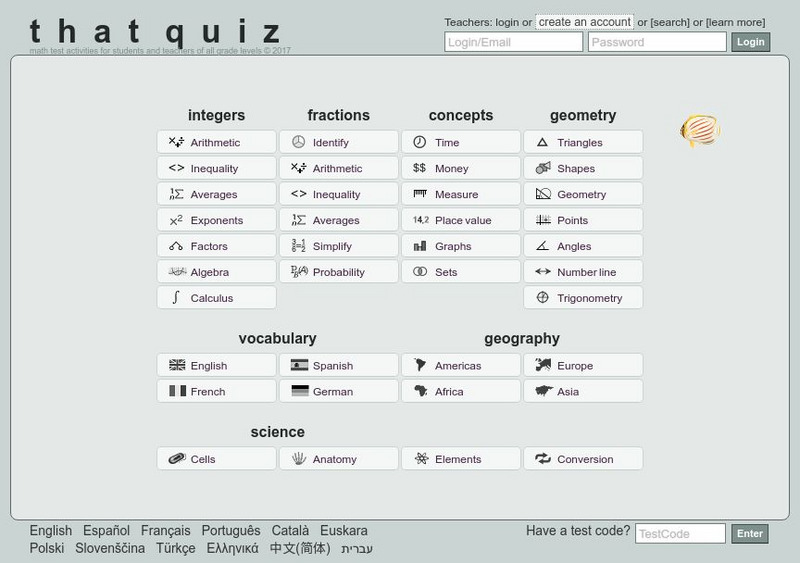
That Quiz
That Quiz
ThatQuiz is an excellent assessment tool for teachers and students. At this site, teachers can create individualized or group assessments on a variety of math topics. Students take these practice assessments directly online and receive...


