CK-12 Foundation
Ck 12: Algebra: Input Output Tables for Function Rules
[Free Registration/Login may be required to access all resource tools.] Evaluate a function rule by finding outputs for a given input
Alabama Learning Exchange
Alex: Math Is Functional
This lesson is a technology-based activity in which students extend graphing of linear functions to the use of spreadsheet software. After students have become proficient in constructing a table of values, students are able to...
Alabama Learning Exchange
Alex: Relationship Between Height and Length
In this lesson, eighth grade young scholars will collect data. They will use this data to analyze the relationship between the height of an individual and the length of his/her foot. Students will use a line of fit to make predictions...
CK-12 Foundation
Ck 12: Algebra: Determining the Equation of a Line
This comprehensive study guide highlights the main terms and formulas needed to determine the equation of a line. Examples are included.
Shodor Education Foundation
Shodor Interactivate: Function Machine
Students investigate very simple functions by trying to guess the algebraic form from inputs and outputs.
Math Open Reference
Math Open Reference: Linear Function Explorer
A thorough reference guide to linear functions. It provides definitions, examples, and an interactive activity that enhances further explanation. Includes links to related topics.
Math Open Reference
Math Open Reference: Average Value
A complete reference guide to the average value. It provides a definition and examples that enhance further explanation. Includes links to related topics.
Concord Consortium
Concord Consortium: Growing Up
Demonstrate your understanding of linear growth graphs.
Khan Academy
Khan Academy: Compare Features of Functions
Compare various features between two functions, each represented in a different way.
PBS
Pbs: Function Machine
Control the inputs and operations of a function machine to produce specific outputs. This interactive exercise focuses on exploring operations, making patterns, and the rules for calculations with positive and negative integers.
Louisiana Department of Education
Louisiana Doe: Louisiana Believes: Eureka Math Parent Guide: Linear Functions
A guide to support parents as they work with their students in linear functions.
Other
Nearpod: Slope Intercept Form
For this lesson on slope-intercept form, students will learn how to write and graph a linear function using the slope-intercept form by learning about the y-intercept and slope.
Other
Nearpod: What Is Slope?
For this lesson on slope, students explore how the rate of change can be identified using a graph, a set of points, and a table.
University of South Florida
Fcat: Exploring Linear Equations: Teacher Notes
This lesson plan guides students through the use of a graphing calculator to explore the slope and y-intercept of a line.
Shodor Education Foundation
Shodor Interactivate: Linear Function Machine
An interactive "machine" allows you to see first hand how a function works. Enter several input values, receive the output values, and determine the algebraic function.
Shodor Education Foundation
Shodor Interactivate: Linear Functions
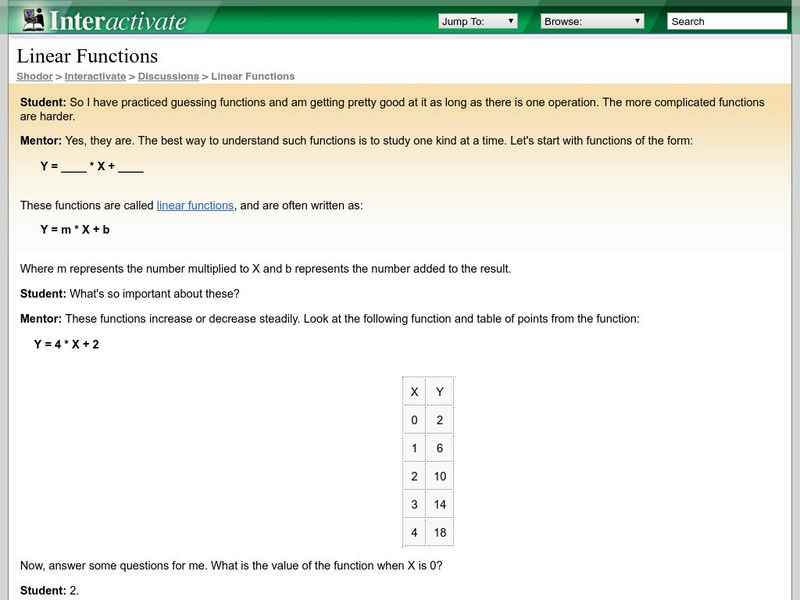
This website introduces the concept of linear functions in slope intercept form.
Paul Dawkins
Paul's Online Notes: Algebra Cheat Sheet [Pdf]
An algebra "cheat sheet" to use as a reference when completing algebra homework. Lists basic facts, properties, operations, formulas, and functions, as well as common errors.
Other
Technical Tutoring: Linear Functions and Straight Lines
Learn how to write equations for linear functions in all three forms: point-slope, slope-intercept, and general. Also look at equations for parallel and perpendicular. The page gives an explanation of how to obtain the point slope form...
Math Graphs
Houghton Mifflin: Math Graphs: Fitting Models to Scatter Plots 1 [Pdf]
Students use a scatter plot to determine whether data can be modeled by a linear function, a quadratic function, a trigonometric function, or that there appears to be no relationship between x and y. The resource consists of an enlarged...
Math Graphs
Houghton Mifflin: Math Graphs: Fitting Models to Scatter Plots 2 [Pdf]
Students use a scatter plot to determine whether data can be modeled by a linear function, a quadratic function, a trigonometric function, or that there appears to be no relationship between x and y. The resource consists of an enlarged...
Math Graphs
Houghton Mifflin: Math Graphs: Fitting Models to Scatter Plots 3 [Pdf]
Students use a scatter plot to determine whether data can be modeled by a linear function, a quadratic function, a trigonometric function, or that there appears to be no relationship between x and y. The resource consists of an enlarged...
Math Graphs
Houghton Mifflin: Math Graphs: Fitting Models to Scatter Plots 4 [Pdf]
Learners use a scatter plot to determine whether data can be modeled by a linear function, a quadratic function, a trigonometric function, or that there appears to be no relationship between x and y. The resource consists of an enlarged...
Math Graphs
Houghton Mifflin: Math Graphs: Fitting Models to Scatter Plots 5 [Pdf]
Students evaluate a scatter plot to determine the relationship between two variables. The scatter plot is available in PDF format.
Math Graphs
Houghton Mifflin: Math Graphs: Fitting Models to Scatter Plots 6 [Pdf]
Learners evaluate a scatter plot to determine the relationship between two variables. The scatter plot is available in PDF format.


