Texas Instruments
Texas Instruments: Getting Started With the Ti Navigator: Discount Savings
This lesson is intended to help students develop an understanding of sale information to compute discounts, discount rates, original prices and sale prices.
Texas Instruments
Texas Instruments: Linear Functions: Slope Intercept Form
Students learn to develop the equation of a line from its graph. They also learn to write the equation of a line from the slope and the y-intercept, a point and the slope, and two points. They also investigate slopes of lines that are...
Texas Instruments
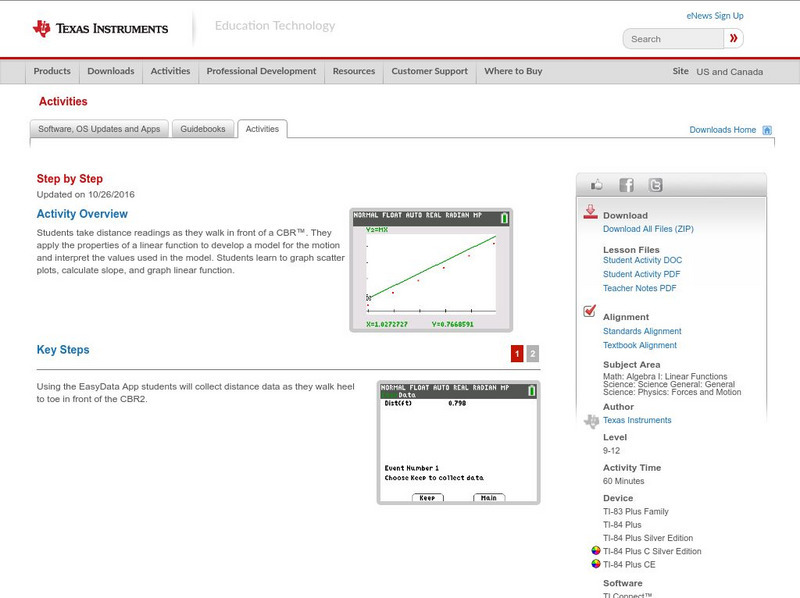
Texas Instruments: Step by Step
In this activity, students take distance readings as they walk in front of a CBR. They apply the properties of a linear function to develop a model for the motion and interpret the values used in the model. Students learn to graph...
Texas Instruments
Texas Instruments: Chill Out: How Hot Objects Cool
Students use a temperature probe to collect data as the warmed probe cools. Students investigate Newton's law of cooling and model cooling data with an exponential function. They fit the data to a mathematical model after analysis.
Texas Instruments
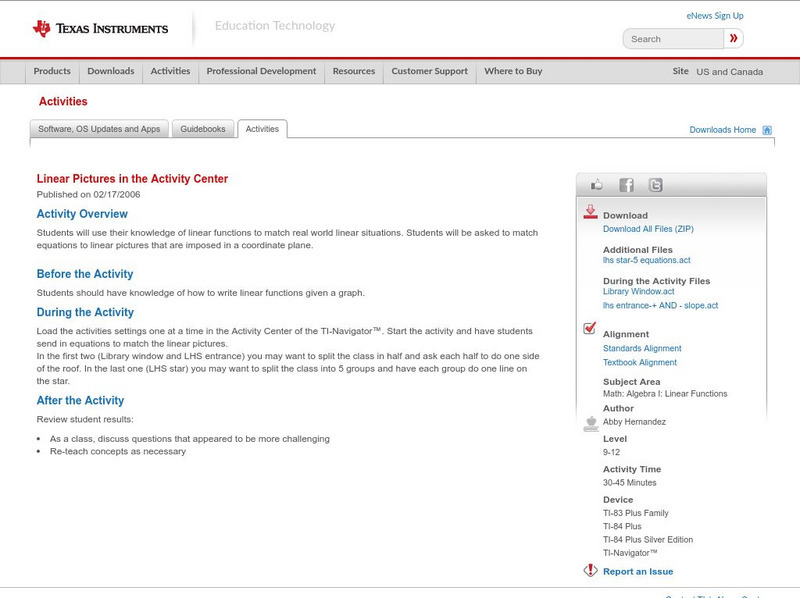
Texas Instruments: Linear Pictures in the Activity Center
Students can use their knowledge of linear functions to match real world linear situations. Students will be asked to match equations to linear pictures that are imposed in a coordinate plane.
Texas Instruments
Texas Instruments: Math Today for Ti Navigator System Humidity Makes Air Feel
Using data from the USA TODAY graphic "Humidity makes air feel hotter" students will explore linear functions to determine how well they model the relationship between air temperature and heat index. When the model has been determined...
Texas Instruments
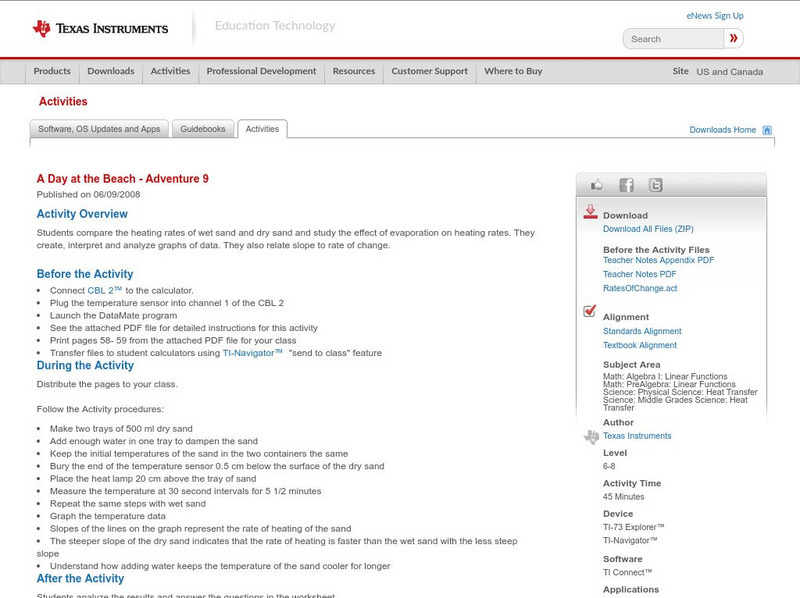
Texas Instruments: A Day at the Beach Adventure 9
Students compare the heating rates of wet sand and dry sand and study the effect of evaporation on heating rates. They create, interpret and analyze graphs of data. They also relate slope to rate of change.
Texas Instruments
Texas Instruments: Ti 73 and Cbl in Data Collection
Using the TI 73 and CBL to collect samples of water for temp, pH, etc connecting math and science curriculums in the middle school.
Texas Instruments
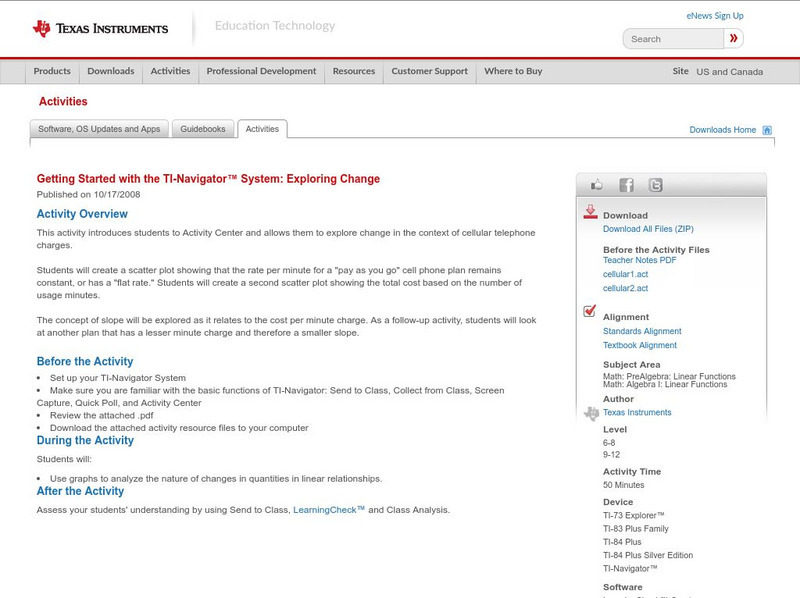
Texas Instruments: Getting Started With the Ti Navigator: Exploring Change
This activity introduces students to Activity Center. In this activity, students will explore change in the context of cellular telephone charges. Students will create a scatter plot showing that the rate per minute for a "pay as you go"...
Texas Instruments
Texas Instruments: Swinging Ellipses: Plotting an Ellipse
In this activity, Students can use a motion detector to record the position and velocity of a swinging pendulum. They will plot the data as a velocity versus position phase plot and determine an ellipse that fits it.
Texas Instruments
Texas Instruments: The Linear Force Relation for a Rubber Band
In this activity, students' will use a force sensor and a motion detector to study the relationship between the force applied to a rubber band and the distance to which it stretches. They will then model force versus strech data with a...
Texas Instruments
Texas Instruments: A Tall Story
In this activity, students can use the motion detector to measure their current height and obtain a mean value. They will use this and earlier data to plot a graph of height versus age. Students will identify the mathematical model that...
Texas Instruments
Texas Instruments: Where Should They Hold the Fundraising Party?
Students learn how to create a table of values for a simple linear function and use the table to create a graph on squared paper. They use the graphing calculator to display the ordered pairs and find values of corresponding to values of...
Texas Instruments
Texas Instruments: Tight Rope
In this activity, students examine quantities that are linearly related and can be visually represented using a straight-line graph. Students collect distance versus time data using a motion detector and find a model for the...
Texas Instruments
Texas Instruments: Stepping to the Greatest Integer: Greatest Integer Function
In this activity, students' will use a motion detector to collect position data showing evenly-spaced jumps in value. They will then model this data using the greatest integer function.
Texas Instruments
Texas Instruments: Titration Curves: An Application of the Logistic Function
In this activity, Students can use a pH sensor to record pH versus base volume data for an acid base titration. They will manually model the curve using a logistic function.
Texas Instruments
Texas Instruments: Use the Regression Feature to Find a Line of Best Fit
This tutorial shows you how to enter a set of data and find the line of best fit.
Texas Instruments
Texas Instruments: What Is Gravity?
In this activity, students will perform a series of experiments with inclined planes. They will learn that as the angle of inclination of the inclined plane approaches 90 degrees, the value of the acceleration of the cart traveling down...
Texas Instruments
Texas Instruments: Behaviors Linear Function
This StudyCard stack teaches and tests on the linear function. Shows connection between the function parameters and the resulting geometric behaviors of the linear function. Use with Foundations for College Mathematics, ch. 2.3, 4.1.
Texas Instruments
Texas Instruments: Getting Started With the Ti Navigator: Picks Theorem
This lesson introduces students to Activity Center and is intended to help students interpret representations of functions of two variables. The Activity Center will be used to investigate equations that represent a company's income,...
Texas Instruments
Texas Instruments: Slope
This StudyCards set promotes understanding of the meaning of slope and evaluation of slope using y/x definition.
Texas Instruments
Texas Instruments: Finding Slope Learn Check
Using the Activity Center, students will explore the characteristics of linear functions in the form y=mx+b. The major focus will be identifying slope and y-intercept.
Texas Instruments
Texas Instruments: Getting Started With the Ti Navigator: Population Change
This lesson introduces students to Activity Center and is intended to help students develop the understanding of how use population information to compute populations, changes and to develop population models to make predictions.
Texas Instruments
Texas Instruments: Walking the Line
In this activity, students use linear functions to model and solve problems in situations with slope and a constant rate of change. They learn to represent situations with variables in expressions, equations, and inequalities and use...


