Curated OER
Fish Communities in the Hudson
Learning to read data tables is an important skill. Use this resource for your third, fourth, or fifth graders. Learners will will study tables of fish collection data to draw conclusions. The data is based on fish environments in the...
Curated OER
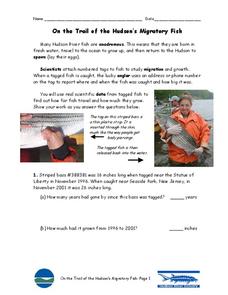
On the Trail of the Hudson's Migratory Fish
Ever wonder how scientists track fish underwater? Your class can learn how with this informative instructional activity. First, they will read a paragraph about androgynous fish, tagging, and data analysis. Then, your scientists must...
Curated OER
Historical Pollution in the Hudson: Part 2
Ninth graders practice how to format and enter data into an Excel spreadsheet, make a graph, and interpret graphed data. They recognize how the pollution in the Hudson River has changed over time, and explain the consequences of these...
Curated OER
Tides in the Hudson
Students view an illustration of the Hudson River watershed and identify the bodies of water shown. They discuss what happens when fresh and salt water mix. Students view a teacher demonstration of the stratification of fresh and salt...
Curated OER
Tens! Hundreds! Thousands!!! of Tons
Fifth graders take a close look at the types of ships that travel through the Hudson River Valley on the Hudson River. They utilize worksheets embedded in the plan in order to answer questions about exactly what is being shipped, and how...
Curated OER
How Much Water is in That River?
Students practice measurement using the Hudson River. They calculate the discharge measurement at a location on the Hudson River using ingenuity and a topographic map.
Curated OER
Invasives and Macroinvertebrates
Young scholars view macroinvertebrates, or discuss previous collection activity. They graph data on macroinvertebrates in the Hudson River. Students discuss the relationship between habitat, environmental changes, and invertebrate...
Curated OER
Zebra Mussel Population Simulation
Students are taught how to format and enter data into an Excel spreadsheet. They make a graph, and interpret graphed data. Students discuss the possible impacts of zebra mussels on the Hudson river. They graph zebra mussel data.
Curated OER
Down in the Dumps
After an introduction to municipal sludge, middle school ecologists consider the pros and cons of dumping in the Hudson River Canyon. The class is split into two groups: one to debate in favor or dumping and one to debate against the...
Curated OER
On the Trail of the Hudson's Migratory Fish
Using data related to the fish in the Hudson River area, learners calculate distance, elapsed time, and growth. They learn about migratory fish, the life cycle of a fish, analyze a map, and answer questions.
Curated OER
River Run Through It
With vocabulary lists, worksheets, and more, this lesson sets learners on an exploration of the Hudson River area. They read an essay about the area, analyze a relief map of New York State, and complete a worksheet.
Curated OER
Is the Hudson River Too Salty to Drink?
In this estuary worksheet, students examine data about the salinity of the Hudson River, create a graph from given data and complete 12 short answer questions about the data and graph.
Curated OER
Salt Front Data Set Activity
For this salt front worksheet, students analyze data from the Hudson River and calculate highest and lowest River Mile locations as well as range of the salt front for each month on the data chart. After completing calculations, they...
Curated OER
The Hudson's Ups and Downs
Fifth graders practice interpreting line graphs of the Hudson River water levels to assess the tides and tidal cycles in the estuary. They explore how weather can affect water levels and tides and observe that high tides and low tides...
Curated OER
Rollin' on The River - the Hudson River!
Students examine how the Hudson River was important to the development of the United States. They examine the role of steamboats played in the development of the Hudson River Valley.
Curated OER
The Hudson's Ups and Downs-Hudson River Activity
In this Hudson River activity, students read a short passage about the river, compare graphs of water levels at different locations, label high and low tides on a graph and interpret, and answer comprehension questions based on several...
Curated OER
Exploring the Hudson in 1609
In this geography worksheet, 5th graders study about the exploration of the Hudson River. Students respond to 7 multiple choice questions about the presented facts.
Curated OER
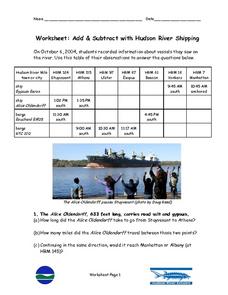
Add & Subtract with Hudson River Shipping
In this shipping on the Hudson River worksheet, middle schoolers record information about types of vessels seen on the Hudson River and respond to the questions that follow about each. Then they identify the Alice Oldendorff which...
Curated OER
Fish Communities in the Hudson
Students use tables of fish collection data to draw conclusions about where fish live in the Hudson Estuary. Given available data they interpret organized observations and measurements and recognize simple patterns, sequences, and...
Curated OER
Tracking the Salt Front
Students manipulate Hudson River salt front data from October 2004 -
September 2005 to locate the high and low points of the salt front for each month, They determine the range for each month, determine the modal range for each month,...
Curated OER
Locating the Salt Front
Students use Hudson River salinity data to create a line
graph that shows the location of the salt front, and use math
skills to explore how this location varies over time. They use the graph to estimate the location of the salt front...
Other
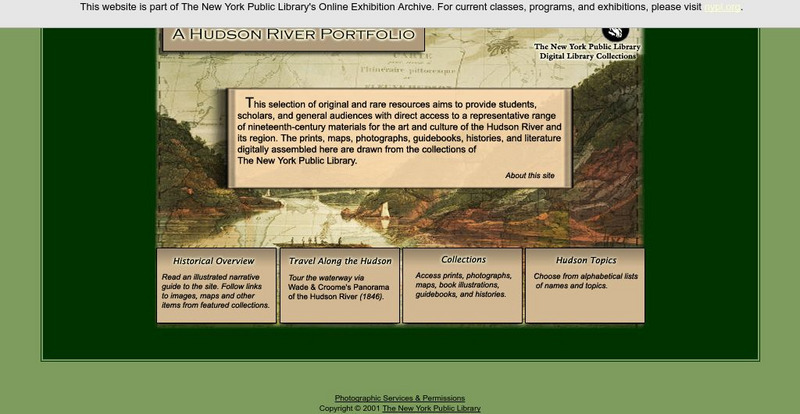
New York Public Library: A Hudson River Portfolio
Learn about the Hudson River and the role it played in the westward and northward expansion of America (to the Great Lakes regions and to Canada) in the nineteenth century. Useful for understanding the importance of rivers as means of...
Other
New Netherland Institute: Virtual Tour of New Netherland
A comprehensive site on the colonization of New Netherland by the Dutch. Find maps, pictures, and artifacts on this interesting tour.
Library of Congress
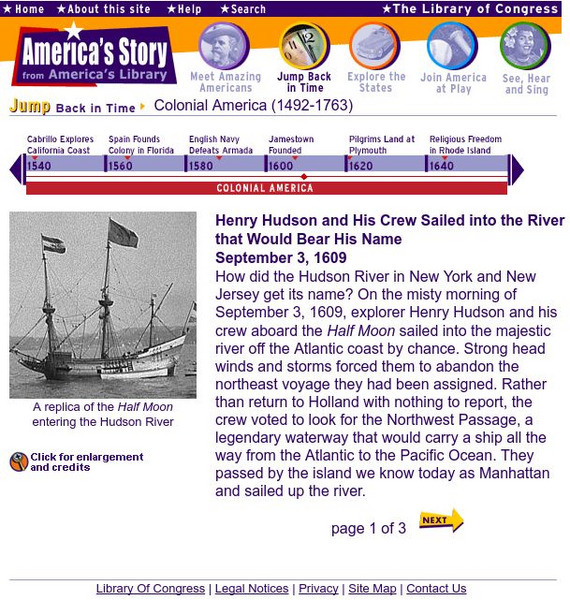
Loc: America's Story: Henry Hudson and His Crew
A retelling of Henry Hudson's historic voyage to New York in 1609, and up the river that would eventually bear his name.


