US Department of Education
National Center for Education Statistics: Create a Graph Tutorial
This tutorial walks students through how to create different types of graphs using the Create a Graph tool available on the website. Covers bar graphs, line graphs, pie charts, area graphs, scatter plots, and dependent and independent...
Texas Instruments
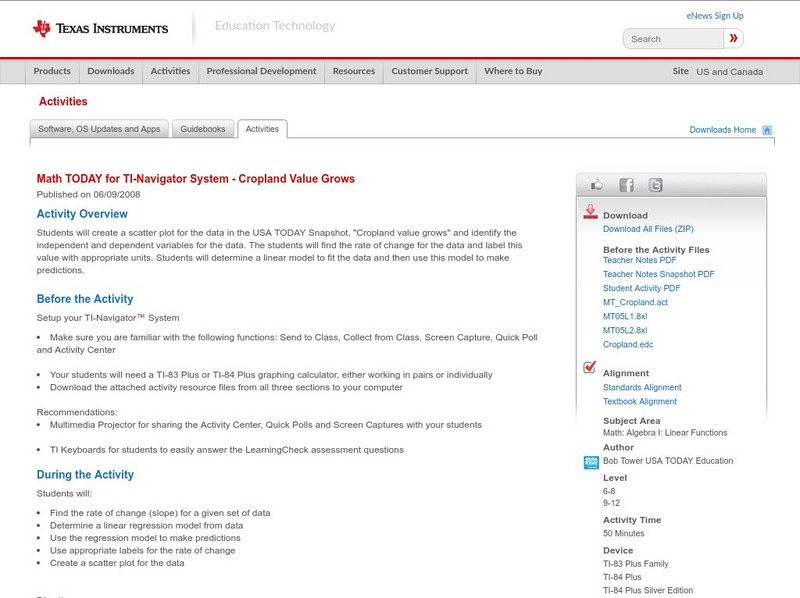
Texas Instruments: Math Today for Ti Navigator System Cropland Value Grows
Students will create a scatter plot for the data in the USA TODAY Snapshot, "Cropland value grows," and identify the independent and dependent variables for the data. The students will find the rate of change for the data and label this...
Texas Instruments
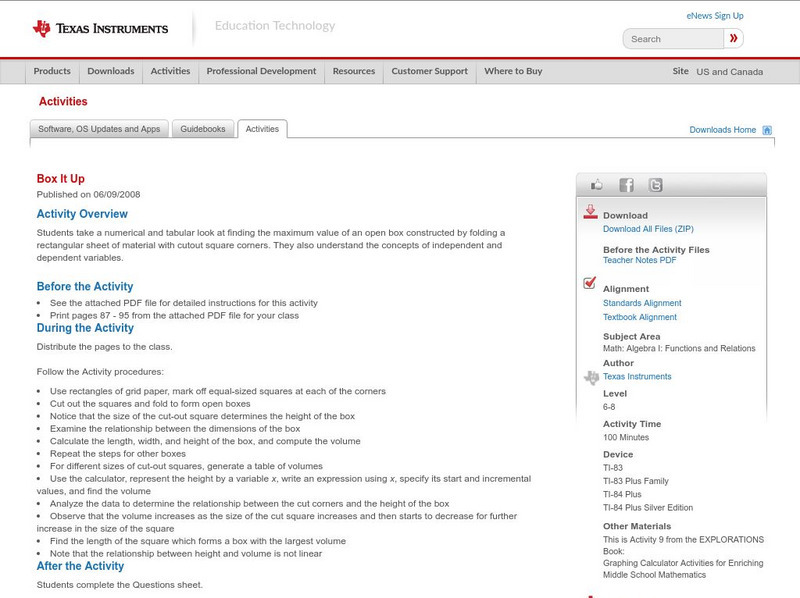
Texas Instruments: Box It Up
Students take a numerical and tabular look at finding the maximum value of an open box constructed by folding a rectangular sheet of material with cutout square corners. They also understand the concepts of independent and dependent...
Texas Instruments
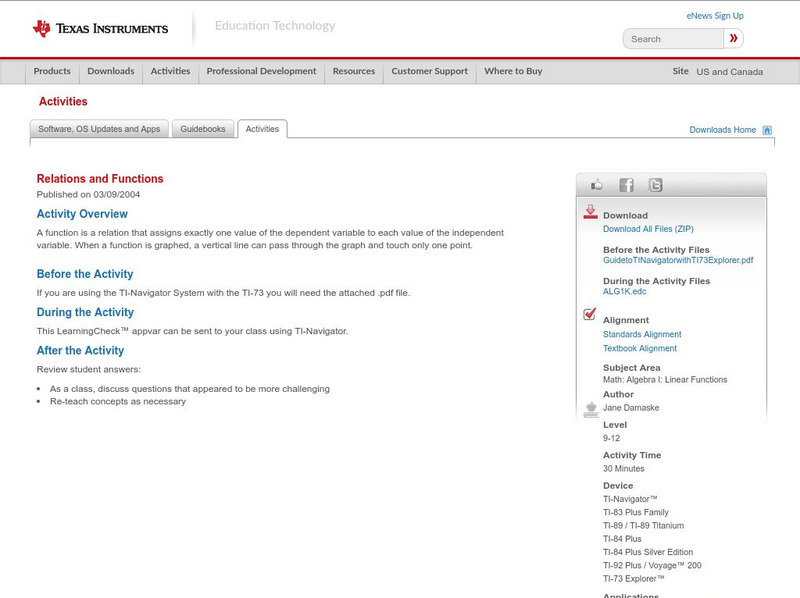
Texas Instruments: Relations and Functions
A function is a relation that assigns exactly one value of the dependent variable to each value of the independent variable. When a function is graphed, a vertical line can pass through the graph and touch only one point.
Texas Instruments
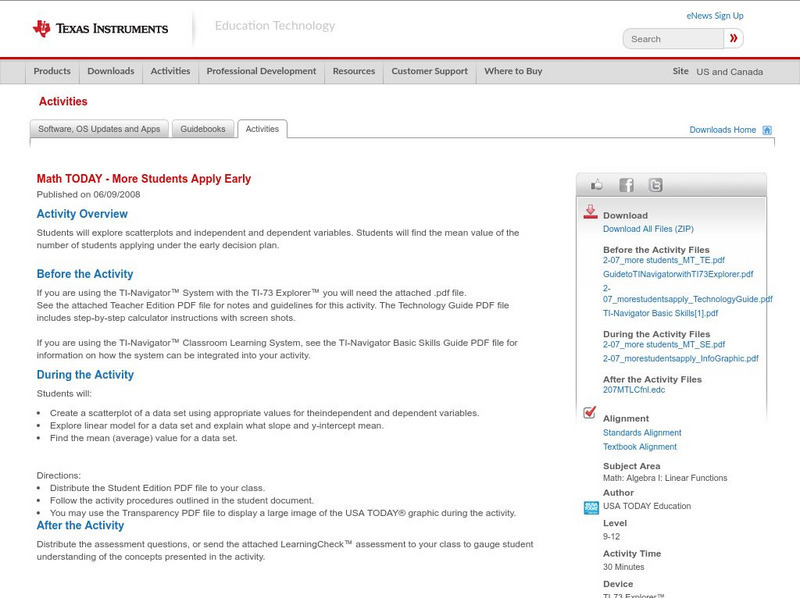
Texas Instruments: Math Today More Students Apply Early
In this activity students will explore scatterplots and independent and dependent variables. Students will find the mean value of the number of students applying under the early decision plan.
Texas Instruments
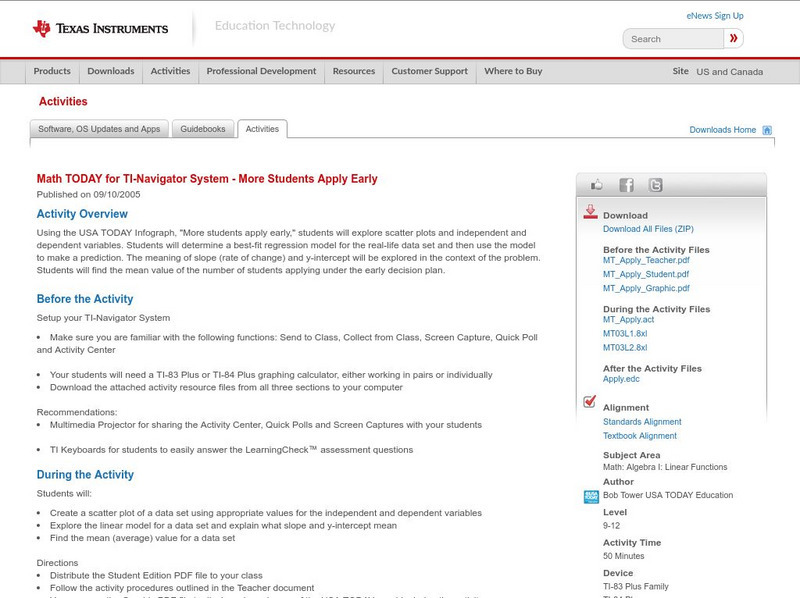
Texas Instruments: Math Today for Ti Navigator System: More Students Apply Early
Using the USA TODAY Infograph, "More students apply early," students will explore scatter plots and independent and dependent variables. Students will determine a best-fit regression model for the real-life data set and then use the...
Texas Instruments
Texas Instruments: Bungee Jumper
Teacher will simulate a Bungee Jumper and have students predict when a Jumper would hit the ground.
Science Education Resource Center at Carleton College
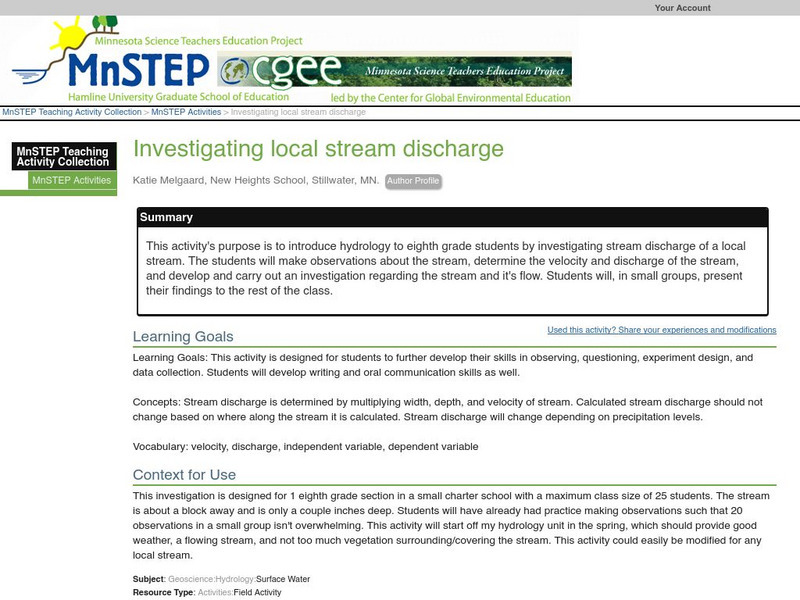
Serc: Investigating Local Stream Discharge
This activity's purpose is to introduce hydrology to eighth grade middle schoolers by investigating stream discharge of a local stream. The students will make observations about the stream, determine the velocity and discharge of the...
Northeast Parallel Architectures Center, Syracuse University
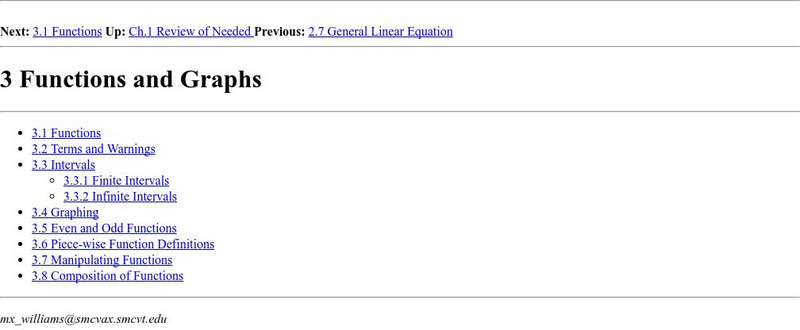
Npac Reu Program: Functions and Graphs
This site from the Northeast Parallel Architectures Center, Syracuse University contains a college level treatment of functions and graphs. Function, element, domain, range, piece-wise functions?? Stuff you know, stuff that's new. Very...
Other
Linear Functions, Slope and Regressions
Find activities here for linear functions, slopes and regression lines. Use them for classroom work or individual assignments.
Sophia Learning
Sophia: Independent/dependent Variables: Lesson 2
This lesson will explain the difference between independent and dependent variables. It is 2 of 4 in the series titled "Independent/Dependent Variables."
Sophia Learning
Sophia: Independent/dependent Variables: Lesson 3
This lesson will explain the difference between independent and dependent variables. It is 3 of 4 in the series titled "Independent/Dependent Variables."
CPALMS
Florida State University Cpalms: Florida Students: Tracking Distance Over Time
Using turtle migration to find the relationship when measuring distance over time.
CK-12 Foundation
Ck 12: Algebra: Consistent and Inconsistent Linear Systems
[Free Registration/Login may be required to access all resource tools.] Identify a system as inconsistent, consistent, or dependent and determine how many solutions a system has.
CK-12 Foundation
Ck 12: Algebra: Determining the Equation of a Line
[Free Registration/Login may be required to access all resource tools.] No description available here...
Texas Education Agency
Texas Gateway: Finding Specific Function Values (Verbal/symbolic)
Given a verbal and symbolic representations of a function, the student will find specific function values.
CK-12 Foundation
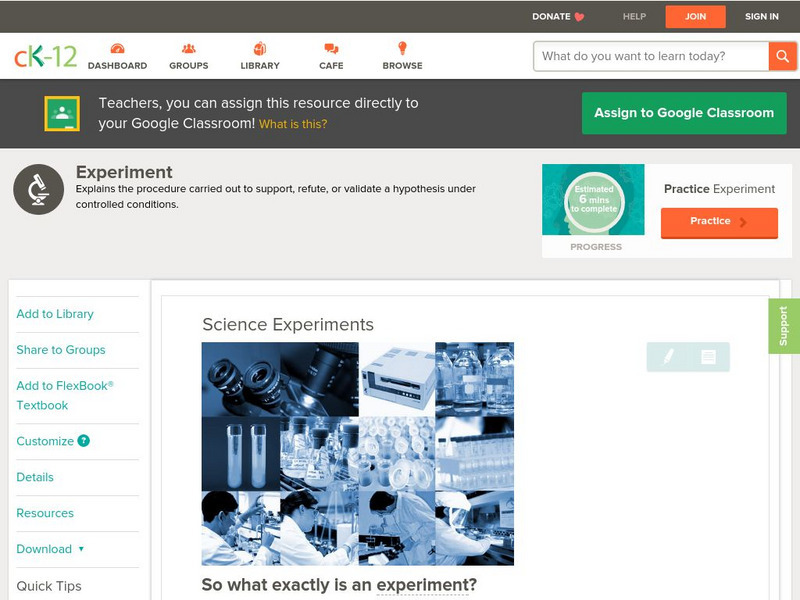
Ck 12: Biology: Science Experiments
[Free Registration/Login may be required to access all resource tools.] Introduction to scientific experiments.
CK-12 Foundation
Ck 12: Algebra: Determining the Type of Linear System
[Free Registration/Login may be required to access all resource tools.] Solve a system and use the result as a guide to identify its type.
CK-12 Foundation
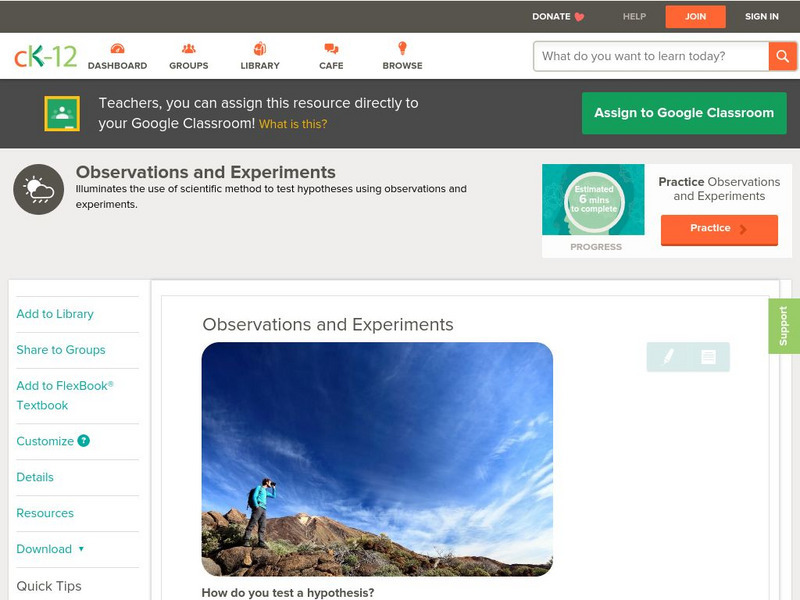
Ck 12: Earth Science: Observations and Experiments
[Free Registration/Login may be required to access all resource tools.] Using observations and scientific experiments to test hypotheses.
Texas Instruments
Texas Instruments: Domain and Range
This StudyCard stack uses real-world contexts to teach the concepts of independent and dependent variables, and then domain and range. It includes practical examples at the end.
TeachEngineering
Teach Engineering: Forces and Graphing
This activity can be used to explore forces acting on an object, to practice graphing experimental data, and/or to introduce the algebra concepts of slope and intercept of a line. A wooden 2x4 beam is set on top of two scales. Students...
CK-12 Foundation
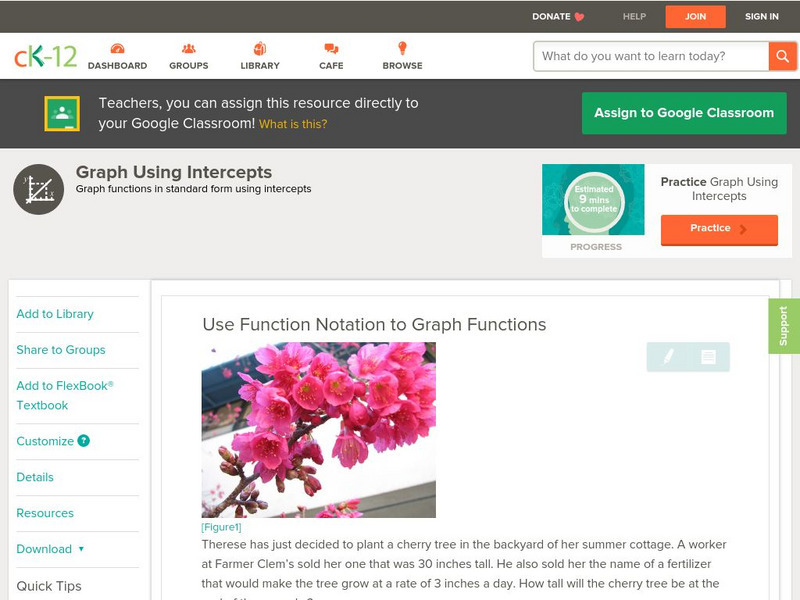
Ck 12: Algebra: Graphs of Linear Functions
[Free Registration/Login may be required to access all resource tools.] Students learn to use function notation to graph functions. Students examine guided notes, review guided practice, study vocabulary, watch instructional videos and...
Shodor Education Foundation
Shodor Interactivate: Lesson: More Complicated Functions: Intro Linear Functions
In this instructional activity, learners learn about linear functions and how they can be represented as rules and data tables. Includes a worksheet with exploration questions to accompany an interactive Linear Function Machine. The...
Illustrative Mathematics
Illustrative Mathematics: F if Points on a Graph
This task will help students understand the difference between between independent and dependent variables. Aligns with F-IF.A.1.


