Alabama Learning Exchange
Alex: Count Your Raisins
In this lesson students will create a class line plot using data collected from boxes of raisins. This activity will be used to collect, organize, represent, and describe data using the line plot.
Wolfram Research
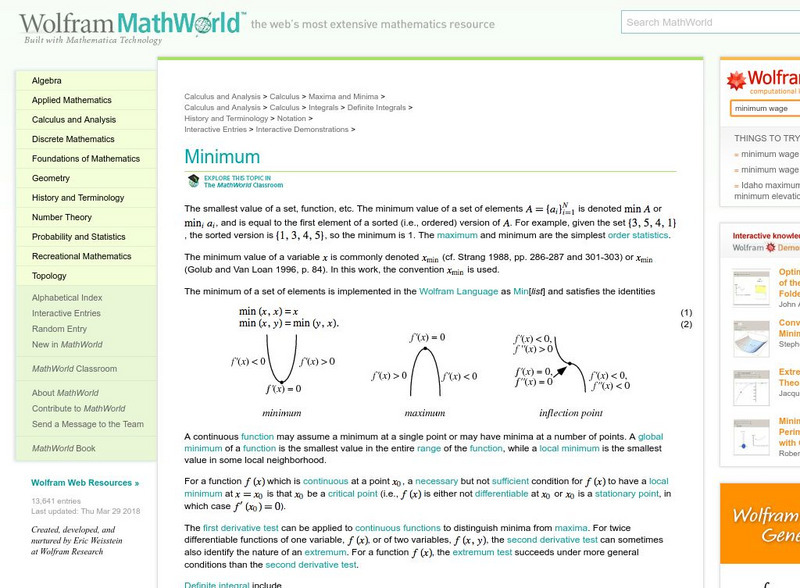
Wolfram Math World: Minimum
This site from Mathworld.com defines the minimum of a function and set.
Wolfram Research
Wolfram Math World: Extremum Test
With this site one may understand how to test a point in a function for a relative minimum, maximum, saddle point, or none of these, by taking derivatives of the function. Explains and performs what is known as the "Extremum Test."
Ministry of Education and Universities of the Region of Murcia (Spain)
Ministerio De Educacion Y Ciencia: Iniciacion a La Programacion Lineal
In Spanish. Practice how to find the value of linear functions at the point of intersection and learn how to locate the maximum and minimum value with this interactive activity.
Other
Jiskha Homework Help: Math Calculus
Jiskha.com offers help with your calculus homework. Use the find button to locate the subject you are interested in. This will take you to the correct link.
Math Graphs
Houghton Mifflin: Math Graphs: Derivative Graph 1 [Pdf]
Students use the graph of the derivative to answer questions regarding the original function. Maximum, minimum, concavity, and slope are investigated. The handout is available in PDF format.
ClassFlow
Class Flow: Box and Whiskers Plot
[Free Registration/Login Required] This is an interactive flipchart for ordering the steps for plotting a box and whiskers. It also allows students to determine the minimum, maximum, median, upper and lower quartiles. Students will also...
ClassFlow
Class Flow: Exploring Quadratic Functions
[Free Registration/Login Required] Use this interactive flipchart to allow students to explore quadratic functions in algebra.
Calculator Soup
Calculator Soup: Statistics Calculator
Calculate basic summary statistics for a sample or population data set including minimum, maximum, range, sum, count, mean, median, mode, standard deviation and variance.
Calculator Soup
Calculator Soup: Quartile Calculator
This quartile calculator and interquartile range calculator finds first quartile Q1, second quartile Q2 and third quartile Q3 of a data set. It also finds median, minimum, maximum, and interquartile range.


