Curated OER
Vernier - A Speedy Slide with EasyData™ App and CBR 2™
Mathematicians use a CBR 2™ motion detector to determine their speed or velocity going down a playground slide. They also experiment with different ways to increase their speed going down the slide. Finally, learners complete the Student...
TeachEngineering
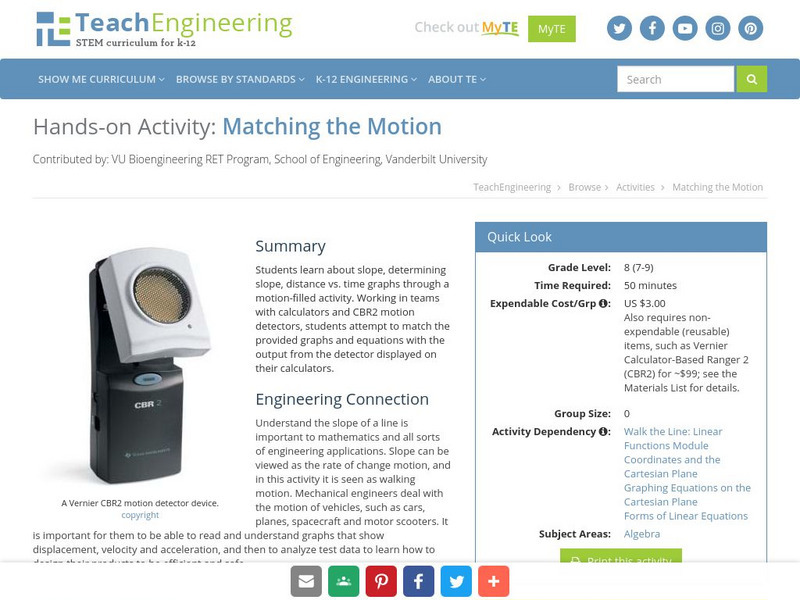
Teach Engineering: Matching the Motion
Students learn about slope, determining slope, distance vs. time graphs through a motion-filled activity. Working in teams with calculators and CBL motion detectors, students attempt to match the provided graphs and equations with the...
Texas Instruments
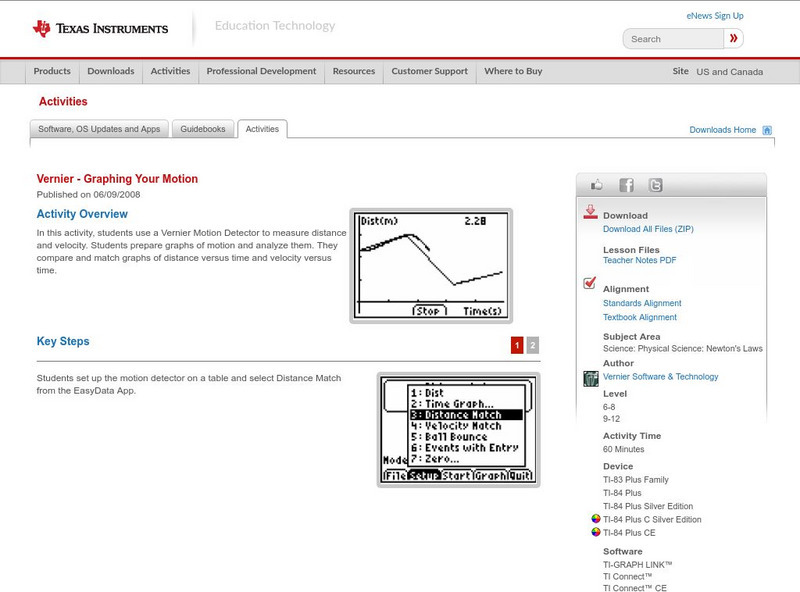
Texas Instruments: Graphing Your Motion
In this activity, students use a Motion Detector to measure distance and velocity. Students prepare graphs of motion and analyze them. They compare and match graphs of distance versus time and velocity versus time.
Texas Instruments
Texas Instruments: Walk This Walk
In this activity, students use a motion detector to create Distance versus Time graphs. They experiment with various Distance-Time graphs and write mathematical descriptions of motion with constant velocity.
Texas Instruments
Texas Instruments: Slow Down: Speed Up
In this activity, students' will use a motion detector to observe the effect of speeding up, slowing down, and moving at a constant rate on a Distance versus Time plot.
Texas Instruments
Texas Instruments: Swing Your Can
Sinusoidal data already obtained by swinging a can over a meter stick and measuring time and displacement from its resting position using a CBR or CBL with a motion detector. Using the TI-Navigator, you can monitor their "real time"...
Texas Instruments
Texas Instruments: Tight Rope
In this activity, students examine quantities that are linearly related and can be visually represented using a straight-line graph. Students collect distance versus time data using a motion detector and find a model for the...
Texas Instruments
Texas Instruments: Walk This Way: Definition of Rate
In this activity, students' will use a motion detector to record distance and velocity versus time information for a walker. They find the area under the velocity versus time graph and compare it to the actual distance traveled by the...
Texas Instruments
Texas Instruments: Vernier a Speedy Slide With Easy Data App and Cbr 2
Students can use a CBR 2 motion detector to determine their speed or velocity going down a playground slide. They will also experiment with different ways to increase their speed going down the slide.
Texas Instruments
Texas Instruments: Shape Up!
In this activity, students can use the motion detector to record motion, and observe how the direction of movement, speed of travel, and the rate of change of direction and speed affect the shape of a distance-time plot.
Texas Instruments
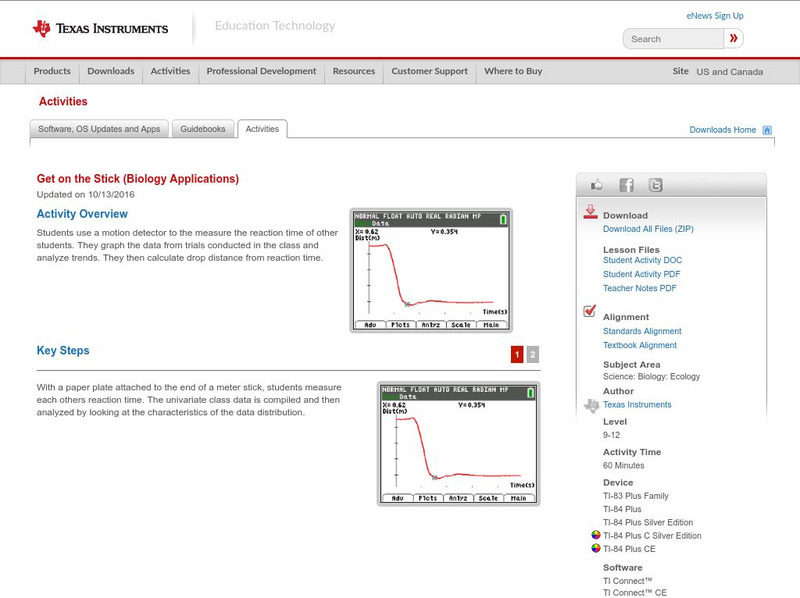
Texas Instruments: Get on the Stick
In this activity, students' use a motion detector to the measure the reaction time of students. They graph the data from trials conducted in the class and analyze trends. They then calculate drop distance from reaction time.
Texas Instruments
Texas Instruments: Falling Objects
In this activity, Students can use a Motion Detector to measure distance and velocity.
Exploratorium
Exploratorium: Science Snacks: Squirming Palm
Create this optical illusion that incorporates what is known as the waterfall effect.
Concord Consortium
Concord Consortium: Stem Resources: Making Waves
Learn how to make waves! Using a motion sensor, students will recreate distance vs. time graphs given in the lab. Lab gives a detailed procedure as well as questions that can be saved online.


